FIGURE 2.

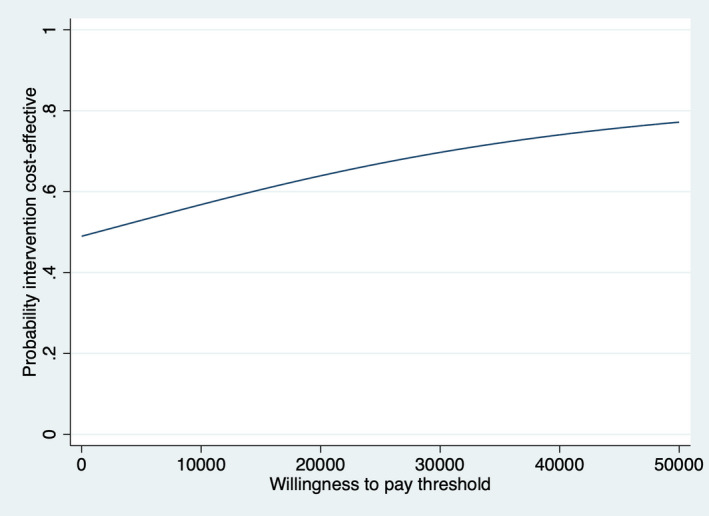
Cost‐effectiveness acceptability curve for Quality‐Adjusted Life‐Years experienced over the 6‐month follow‐up period by the informal caregiver (exergaming versus control) [Colour figure can be viewed at wileyonlinelibrary.com]

Cost‐effectiveness acceptability curve for Quality‐Adjusted Life‐Years experienced over the 6‐month follow‐up period by the informal caregiver (exergaming versus control) [Colour figure can be viewed at wileyonlinelibrary.com]