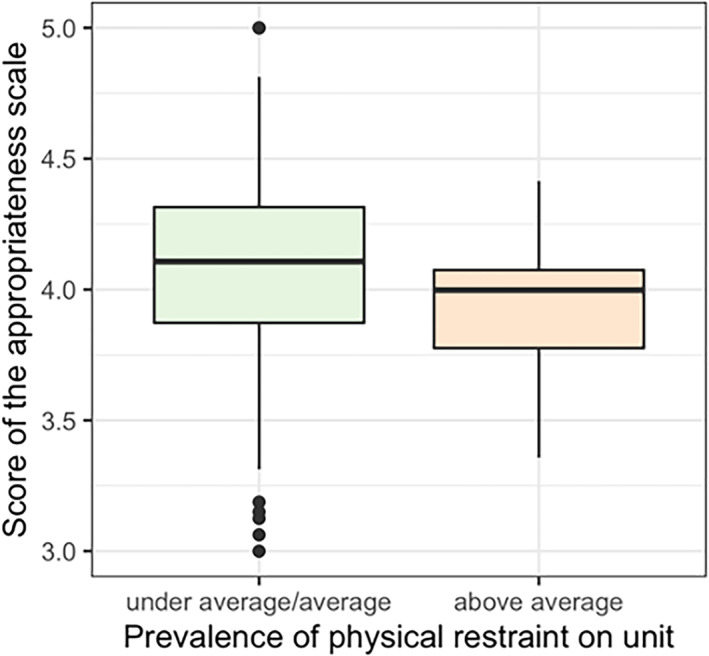
FIGURE 1.

Boxplot of the “appropriateness of restraint use” subscale scoring in relation to the prevalence of physical restraint use on the unit. The units are stratified into two groups: units with under‐average as well as average use of restraints versus units with above‐average use of physical restraints compared to the sample mean. Maastricht Attitude Questionnaire (MAQ) subscale scores range from 1–5. Lower scores (towards 1) indicate more negative attitudes, that is, finding the use of restraints inappropriate, while higher scores (towards 5) indicate more positive attitudes towards restraints, that is, finding the use of restraints appropriate. The average group included n = 268 units; the above‐average group included n = 23 units
