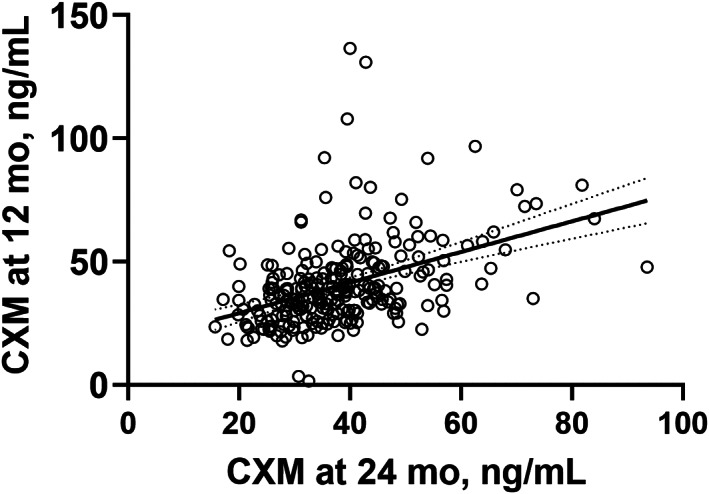
Fig. 1.

Scatter plot of CXM values (ng/mL) at two time points: child age 12 and 24 months (Pearson's correlation coefficient 0.45, p < 0.001, n = 250). Line represents the simple linear regression with 95% confidence bands of the best‐fit line. CXM = collagen X biomarker.
