
FIGURE 2.
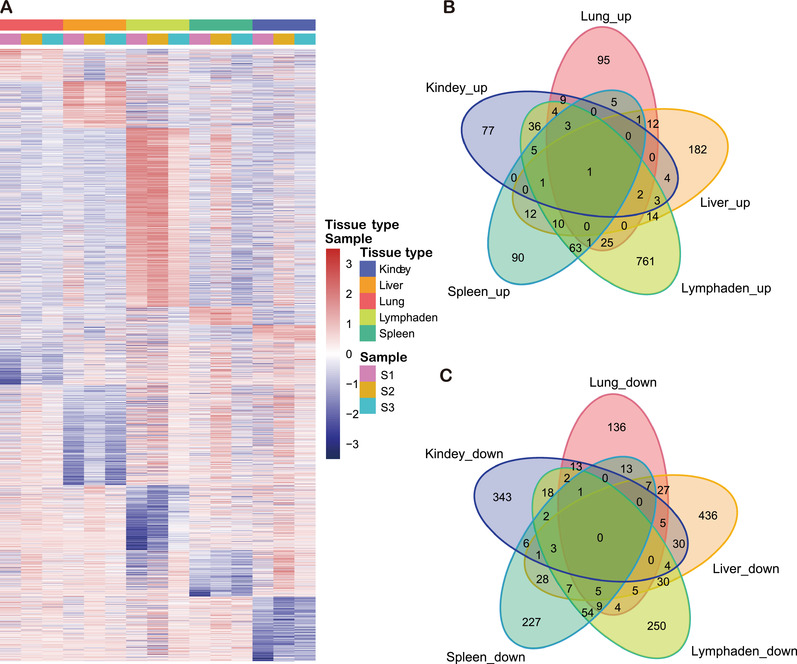
Summary of differentially expressed genes (DEGs) among infected kidney, liver, lung, lymph node and spleen tissues. (a) A hierarchical clustering heat map was used to classify gene expression patterns among each infected tissue. Genes with an FDR‐corrected p value ≤ .05 and a fold change value ≥2 were considered DEGs. Each column represents a sample, and each row represents a gene. The intensity of colour indicates gene expression levels normalized according to log10 (TPM+1) values. Red indicates a high expression level and blue indicates a low expression level. Panels (b) and (c) were Venn diagram analysis of the common up‐regulated and down‐regulated DEGs in different ASFV‐infected tissues