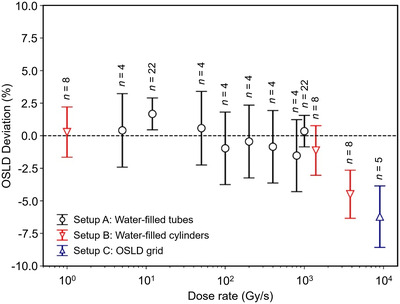
FIGURE 4.

The optically stimulated luminescence dosimeters (OSLDs) dose measurement relative to the nominal dose as a function of the dose rate for the three setups studied by Christensen et al. 129 The number of aggregated data points for each dose rate is given above each marker. The appearance of an under‐response above 1000 Gy/s is due to signal averaging of the narrow pencil beam over the OSLDs and is not manifestation of a dose‐rate dependency
