
FIGURE 1.
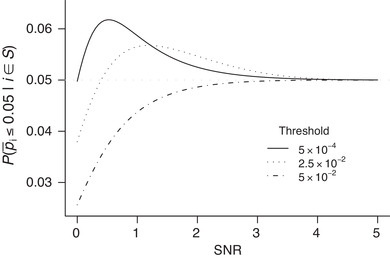
Conditional ‐value of the true union hypothesis: 5% quantile as a function of a signal‐to‐noise ratio of a possibly false component hypothesis. Solid, dotted, and dot‐dash curves correspond to the threshold , and , respectively. Dotted horizontal line is added for reference