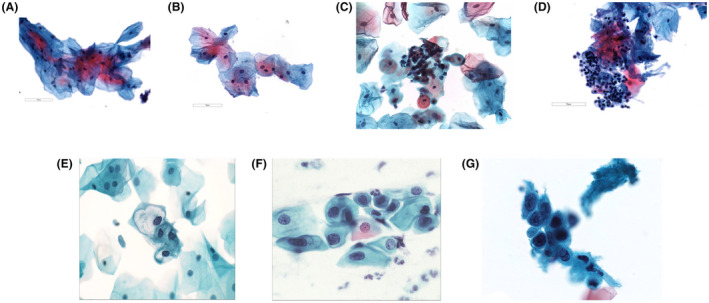
FIGURE 1.

(A) Normal superficial and intermediate squamous cells. (B) A sheet of atypical squamous cells of undetermined significance (note there is a slight increase in N/C ratio ≤ 10% with even chromatin distribution) (×400). (C) Sheets of immature squamous cells exhibiting slightly enlarged nuclei with dense chromatin suggestive of changes consistent with oral lichen planus/lichenoid lesion (×400). (D) Sheets of degenerative squamous cells associated with lymphocytes suggestive of changes consistent with oral lichen planus/lichenoid lesion. Note there is a slight increase in N/C ratio ≤ 10% with even chromatin distribution (×400). (E) Squamous intraepithelial lesion (low grade). Note the increase in N/C ratio ≤ 50% (×500). (F) Squamous intraepithelial lesion (high grade). Note the increase in N/C ratio > 50% and ≤ 75% (×500). (G) Squamous cells suggestive of OSCC. Note the massive increase in N/C ratio ≥ 75% (×500). N/C indicates nuclear/cytoplasmic ratio; OSCC, oral squamous cell carcinoma
