
Figure 5.
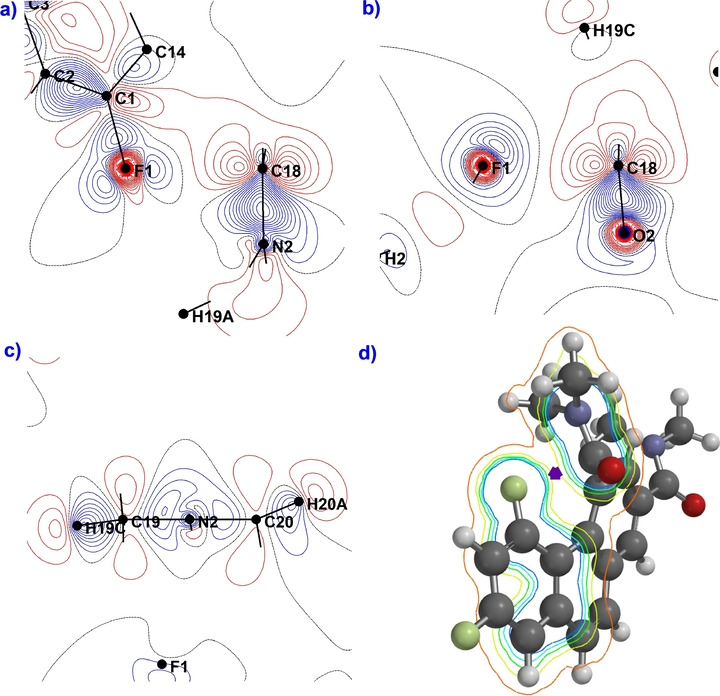
Contour slices of the static deformation density map in the vicinity of the F‐amide region of 3 (positive (blue) and negative (red) contours are drawn at intervals 0.05 e Å−3, black=0.00 e Å−3). a) Primarily electrostatic interaction along the F−carbonyl axis, (C18 denotes the probe carbonyl carbon). b) Alternate view including the C−O axis. c) Anomalous electron density surrounding the pyramidalized probe amide nitrogen. d) NBO‐derived electron density contour slice calculated at M062X/6‐311++G** (0.04 isovalue) of 3 bisecting the axis of the C−F—C=O interaction (Spartan Program). The purple polygon marks an effective saddle point.