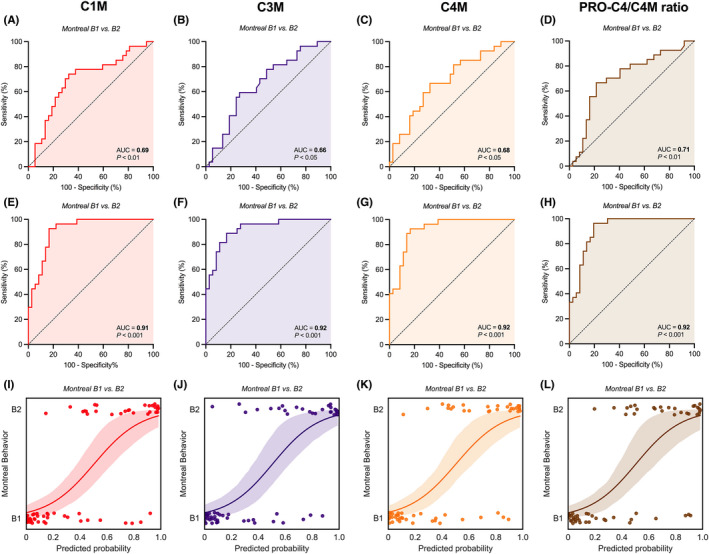
FIGURE 3.

(A–L) Capacity of serological biomarkers of type I, III and IV collagen degradation (C1M, C3M and C4M, respectively) and the type IV collagen formation/degradation ratio (PRO‐C4/C4M ratio) to discriminate between non‐stricturing, non‐penetrating (Montreal B1) and stricturing (Montreal B2) CD. Unadjusted (A–D) and adjusted (E–H) ROC curves demonstrate significant discriminative capacity of serum C1M, C3M and C4M levels and the PRO‐C4/C4M ratio with regard to non‐stricturing, non‐penetrating disease (B1) versus stricturing disease (B2). Predicted probabilities (I–L) derived from the multivariable logistic regression models, representing the odds of having stricturing (Montreal B2) CD and determining the course of the ROC curves as shown in panels (E–H), are substantially separated between both disease behaviour subtypes. The lines with associated 95% confidence intervals (colour shade) represent the fitted logistic regression lines. Abbreviation: AUC, area under the ROC curve.
