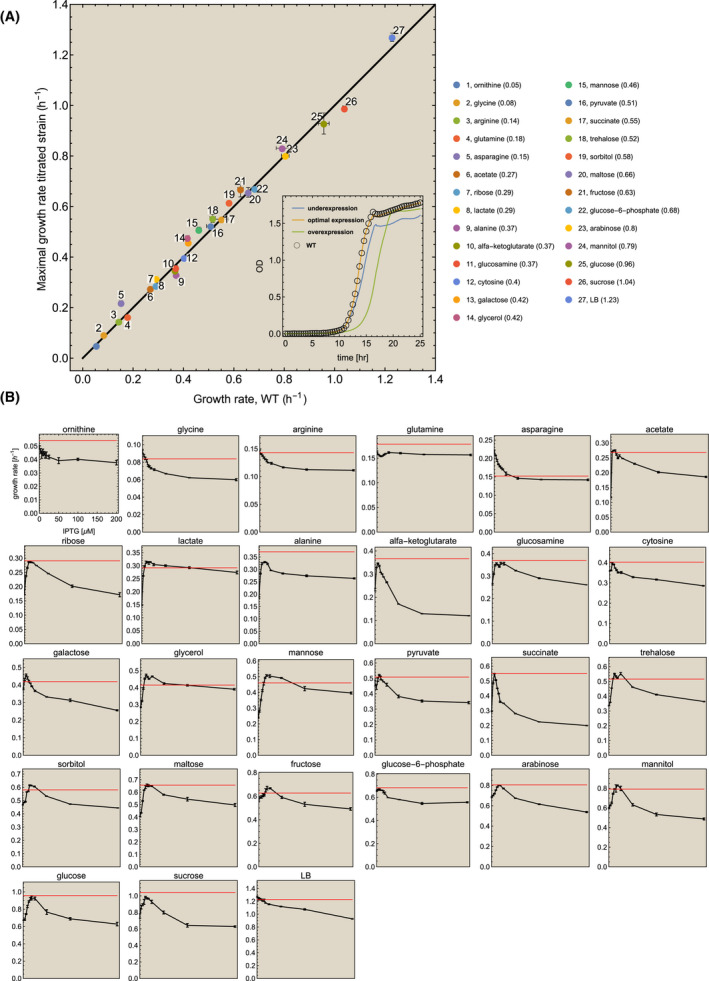
Fig. 2.

Robust, growth rate maximizing expression of ATPase. The wildtype and the ATPase titratable strain were grown in 27 different conditions. (A) At each condition, the optimal growth rate of the titratable strain was plotted as function of the growth rate of the wildtype. Error bars indicate the standard deviation. The growth rates of the wildtype and the mutant were compared at the optimal IPTG concentration. The growth rate of the wildtype strain is indicated in the legend after the name of the nutrient and indicated by the red line in the small plots below. The inset shows the growth profiles on glucose of the mutant strain, grown at underexpression, optimal expression and overexpression conditions (as lines), and the wildtype as open circles. The profile of the wildtype overlaps with that of the mutant at optimal conditions. (B) For each condition, a plot of the growth rate of the mutant strain (± SEM) as function of the IPTG concentration is shown (the axes are only shown once). The red line indicates the mean growth rate of the wildtype (at the optimal IPTG concentration). Note that the growth rate does not go to zero at high IPTG concentrations. There, the promoter is at maximal activity and ATPase cannot be increased more in concentration. Only with a stronger promoter or multiple gene copies would a higher reduction in growth rate become achievable. Also, the promoter is a bit leaky, leading to some expression at zero IPTG. We only show the growth rate values and IPTG concentrations for ornithine, the growth rate range of the other nutrients are different.
