
Figure 2.
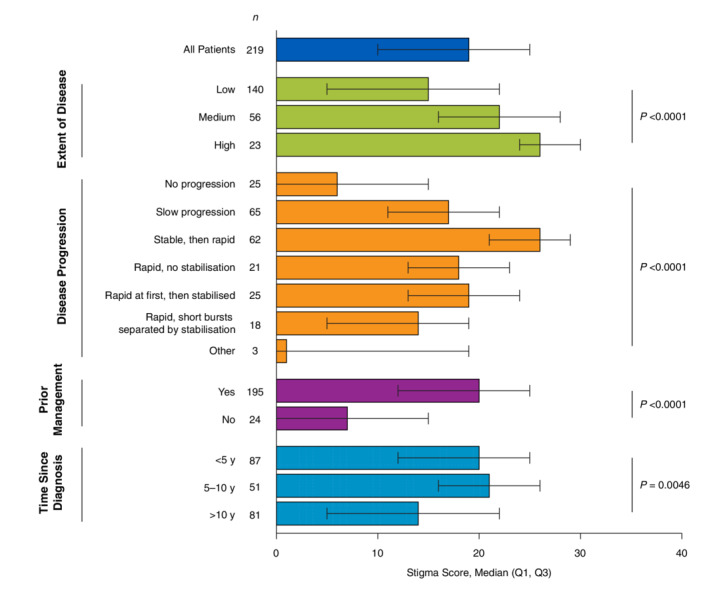
Stigma score stratified by vitiligo disease characteristics. Q1, quartile 1; Q3, quartile 3. Higher scores indicate poorer quality of life. P values were derived from the non‐parametric Kruskal–Wallis test.
Official websites use .gov
A
.gov website belongs to an official
government organization in the United States.
Secure .gov websites use HTTPS
A lock (
) or https:// means you've safely
connected to the .gov website. Share sensitive
information only on official, secure websites.
Stigma score stratified by vitiligo disease characteristics. Q1, quartile 1; Q3, quartile 3. Higher scores indicate poorer quality of life. P values were derived from the non‐parametric Kruskal–Wallis test.