Figure 4.

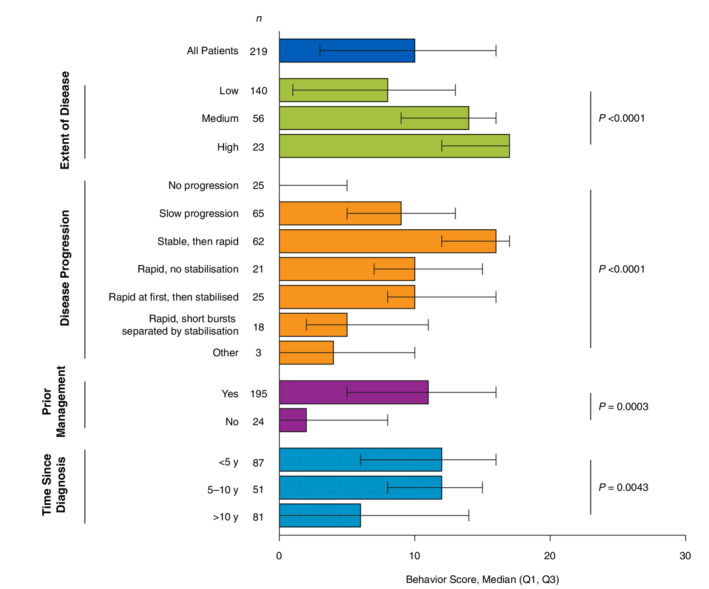
Behaviour score stratified by vitiligo disease characteristics. Q1, quartile 1; Q3, quartile 3. Higher scores indicate poorer quality of life. P values were derived from the non‐parametric Kruskal–Wallis test.

Behaviour score stratified by vitiligo disease characteristics. Q1, quartile 1; Q3, quartile 3. Higher scores indicate poorer quality of life. P values were derived from the non‐parametric Kruskal–Wallis test.