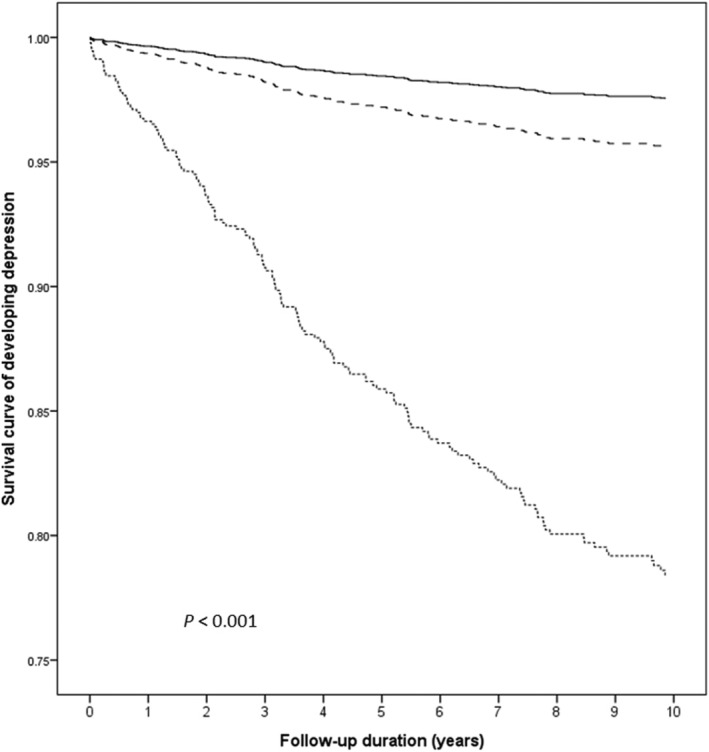
Figure 1.

Kaplan–Meier survival curve of developing depression among patients with inflammatory bowel disease, their unaffected siblings, and control group.  , Control group;
  , unaffected siblings;
  , inflammatory bowel disease probands.

Kaplan–Meier survival curve of developing depression among patients with inflammatory bowel disease, their unaffected siblings, and control group.  , Control group;
  , unaffected siblings;
  , inflammatory bowel disease probands.