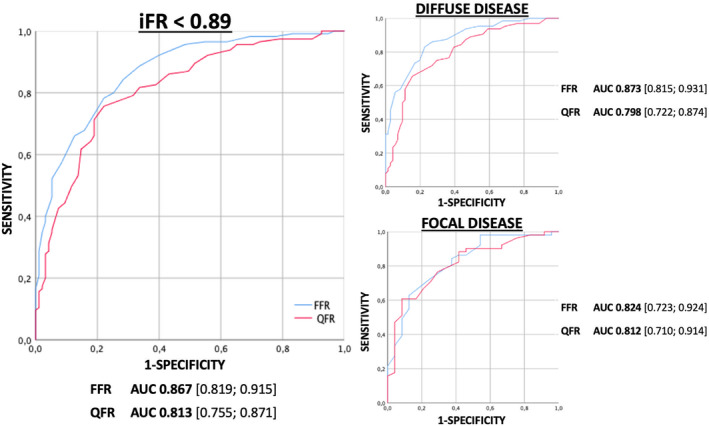
FIGURE 2.

ROC curves analysis. Diagnostic performance of QFR in predicting iFR < 0.89 in the overall population and according to iFR pullback defined pattern of CAD. CAD, coronary artery disease; iFR, instantaneous wave‐free ratio; QFR, quantitative flow reserve; ROC, receiver operator characteristic [Color figure can be viewed at wileyonlinelibrary.com]
