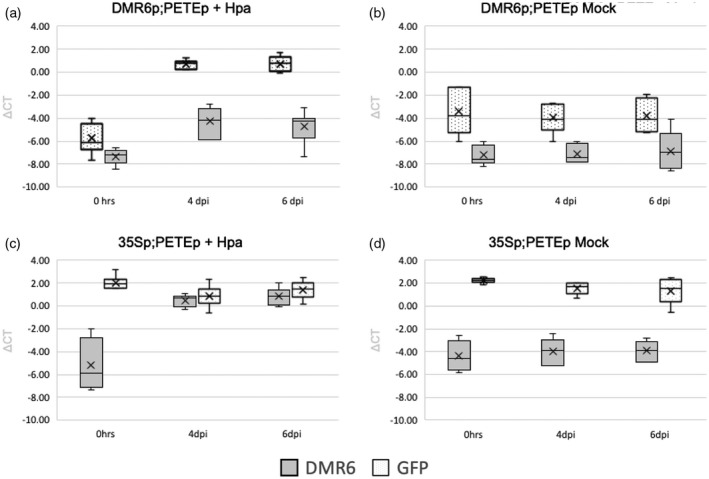
Figure 7.

DMR6p and 35Sp activity over the course of infection. RT‐qPCR data are shown from 0, 4, and 6 dpi in infected and mock samples. Actin 2 was used for normalization. (a) DMR6p;PETEp line, infected with Hpa. Data from seven replicates. (b) DMR6p;PETEp line, mock control. Data from four replicates. (c) 35Sp;PETEp line, infected with Hpa. Data from six replicates. (d) 35Sp;PETEp line, mock control. Data from six replicates.
