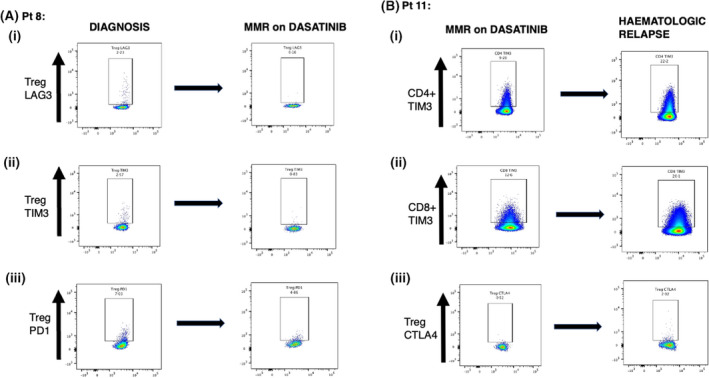
FIGURE 2.

Longitudinal analysis of T‐cell immune‐checkpoint expression in paired samples from two CML patients evaluated at different disease stages. (A) Increased Treg expression of immune checkpoint‐molecules observed in patient at diagnosis (left column) compared with from the same patient after achieving MR3 (right column) following dasatinib treatment for 11 months. (i) LAG‐3 expression, (ii) TIM‐3 expression and (iii) PD‐1 expression. (B) Reduced expression of immune‐checkpoint molecules observed in another patient when in MR3 (left column) compared with samples from same patient at haematological relapse (right column). (i) CD4+ TIM‐3 expression, (ii) CD8+ TIM‐3 expression and (iii) Treg CTLA‐4 expression.
