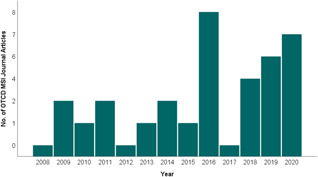
Figure 2.

Frequency of OTCD/MSI publications since 2008. This figure is based on the average number of relevant results from the Pubmed and EBSCO (Medline) databases with the following search terms (((On tissue derivatization) AND (On tissue derivatization)) AND (Mass spectrometry)) AND (Imaging)) from years 2008–2020. Review articles were not counted. Only those which described OTCD in tandem with MSI analysis as a method used in their analysis. A sharp increase in 2016 is seen followed by a dip in 2017. However, it can be seen that since 2018, the number of papers, which include OTCD/MSI, is on a rising trend. MSI, mass spectrometry imaging; OTCD, on‐tissue chemical derivatization [Color figure can be viewed at wileyonlinelibrary.com]
