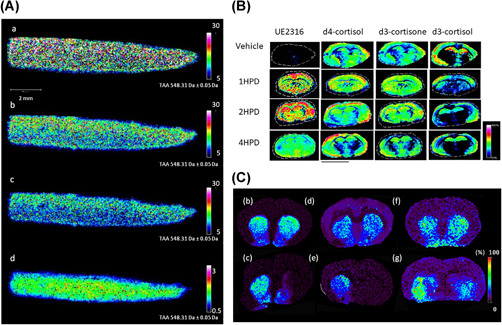
Figure 5.

Examples of OTCD with MALDI MSI in pharmacology, intracrinology, and neurosciences. (A) Pharmacology: MALDI‐MSI visualization of the distribution of triamcinolone acetonide (TAA) with OTCD using Girard's T reagent on osteoarthritis cartilage tissue sections using different normalization methods: (a) nonnormalization, (b) median normalization, (c) TIC normalization, (d) normalization against the labeled analog of the drug. Adapted from Barré et al. (2016) with permission. (B) Intracrinology: Evaluation of changes in abundances of UE2316, d4‐cortisol (d4F), d3‐cortisone (d3E), and d3‐cortisol (d3F) at varying time points (HPD) in murine brain regions, measured following OTCD using Girard's T reagent. Adapted from Cobice et al. (2018) with permission. (C) Neurosciences: MALDI‐MSI images of dopamine (DA) in coronal tissue sections of control (b, d, f) and unilaterally 6‐OHDA lesioned (c, e, g) rat brains after derivatization with DPP (b, c), PBDPP (d, e) or TMP (f, g). Signal intensity is indicated using a rainbow scale. Scale bar = 2 mm; spatial resolution = 120 μm. Adapted from Shariatgorji et al. (2015), with permission. DPP, 2,4‐diphenyl‐pyranylium; HPD, hours postdosing; MALDI, matrix‐assisted laser desorption/ionization; MSI, mass spectrometry imaging; OTCD, on‐tissue chemical derivatization [Color figure can be viewed at wileyonlinelibrary.com]
