
Figure 1.
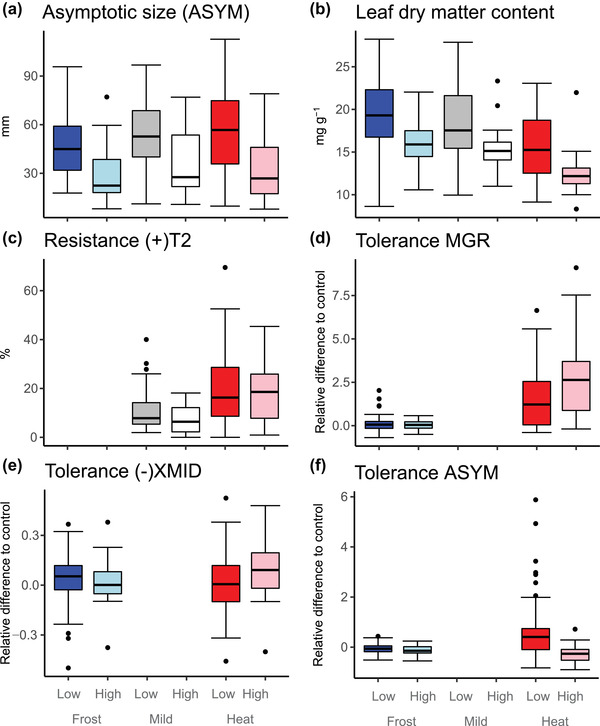
Boxplot showing the distribution of species‐mean trait values for which species differed depending on their median elevation (low vs. high elevation), either across growth treatments or in a particular growth treatment (regular frost, mild, regular heat). For simplicity, only data of the second round of sowing are included and traits for which mixed‐effects models and evolutionary models produced concordant results (data of both rounds of sowing and all traits shown in Fig. S2). Colors inside boxes represent the treatments (blue for Frost, grayscale for Mild, and red for Heat), whereas the intensity represents median elevation of species occurrence (dark colors for low elevation, light colors for high elevation). The thick horizontal line is the median, and the lower and upper hinges are the 25th and 75th percentiles; whiskers extend from the hinges to the most extreme data points within 1.5 × IQR, and dots are values beyond those ranges.