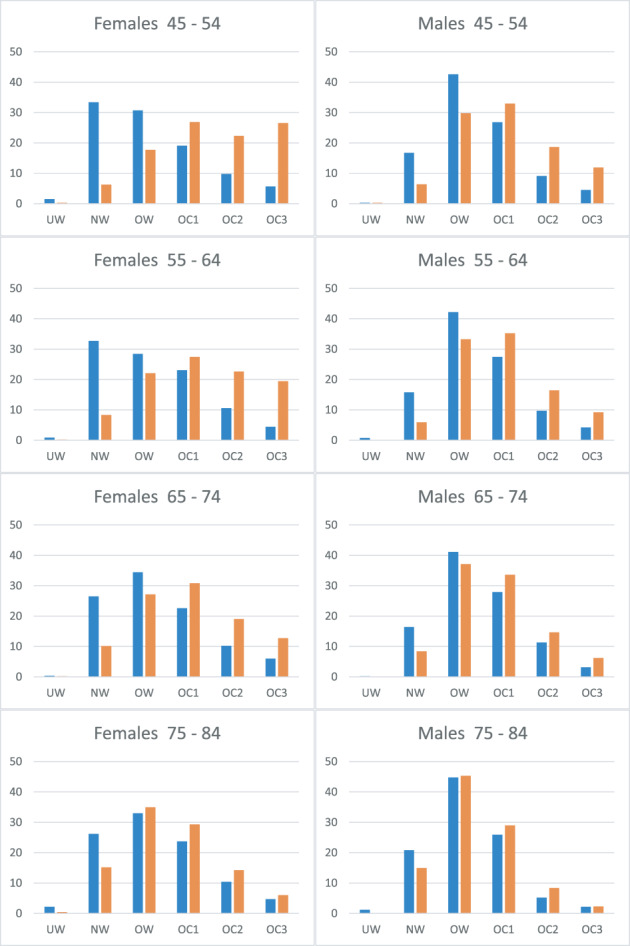
Fig. 1.

Percentage of individuals in each body mass index category, by age and gender. Blue bars, Australian Bureau of Statistics population estimate; orange bars, knee replacement patients. UW, underweight; NW, normal weight; OW, overweight; OC1, obese class 1; OC2, obese class 2; OC3, obese class 3.
