
FIGURE 4.
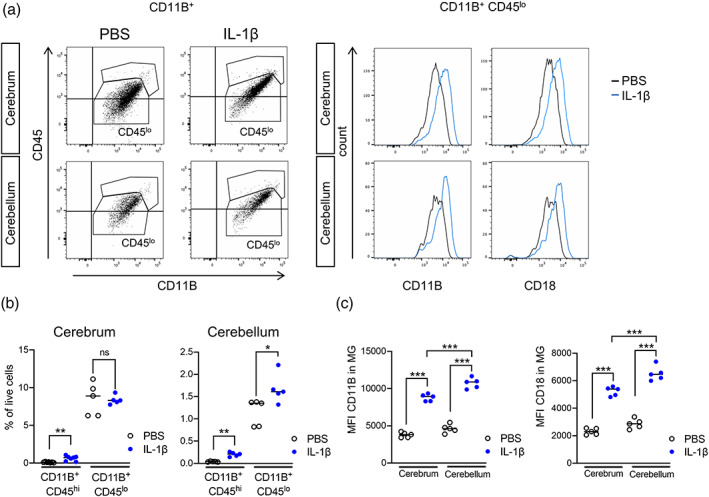
Impact of systemic inflammation on microglia. (a) Representative picture of flow cytometry gating strategies to analyze brain CD11B+ and CD11B+/CD45int cells from the cerebrum and cerebellum of P5 IL‐1β‐treated and PBS treated mice and (b) the quantification of this data. (c) Quantification of dot plot analysis by flow cytometry of CD11B/CD18 MFI in CD11B+/CD45int microglia in cerebellum and cerebrum from P5 IL‐1β‐treated and control mice. Shapiro–Wilk test was used to verify normal distribution of each data set. Two‐tailed Student t‐tests were realized on data. ++++ = cerebrum versus cerebellum or CD45hi versus CD45lo, p < .001; **** = PBS versus IL‐1β, p < .0001; *** = PBS versus IL‐1β, p < .001; ** = PBS versus IL‐1β, p < .01. PBS, phosphate buffered saline