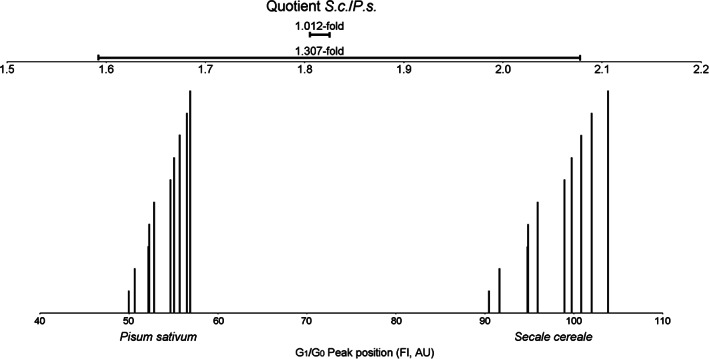
FIGURE 1.

Lower scale: Illustration of the effect of G1/G0 peak position variation (in arbitrary units (AU)) on the fluorescence intensity (FI) axis of co‐chopped Secale cereale (S.c.) and Pisum sativum (P.s.) in two simultaneous preparations after five measurements each. The corresponding S.c./P.s. G1/G0 peak pairs share the same height and the peak shifts on the fluorescence intensity axis are clearly visible. The quotient accuracy is illustrated by the high congruency of the order of the columns (the height of the columns does not correspond to the time of measurement). Upper scale: The short (upper) horizontal bar represents the S.c./P.s. ratio range resulting from internal standardization (1.012‐fold), whereas the large (lower) horizontal bar represents the ratio range between the two extreme values (1.31‐fold) resulting from recalculation in order to reproduce external standardization. During the course of measurement, the peaks tended to shift to the right side on the x‐axis of the histogram
