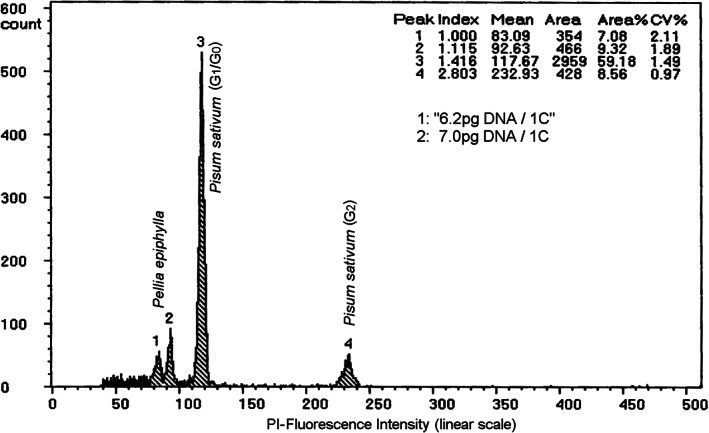
FIGURE 2.

Fluorescence intensity variation among nuclei released from different cell types in the liverwort Pellia epiphylla (P.e.). Peak 1 contains male gamete nuclei emitting lower fluorescence intensity compared with the Peak 2, which contains somatic nuclei of the gametophyte. The variation of the fluorescence intensity is 1.115‐fold (index) and results from the stainability variation between the two different cell types. The Peaks 3 and 4 refer to the Pisum sativum (P.s.) G1/G0 and G2 nuclei respectively. The P. e. 1C‐value calculated from somatic tissues from both, P.e. and P.s. was 7.0 pg, whereas a false 1C‐value of 6.2 pg (given between quotation marks) resulted from the calculation, when the male gametes were used for C‐value calculation
