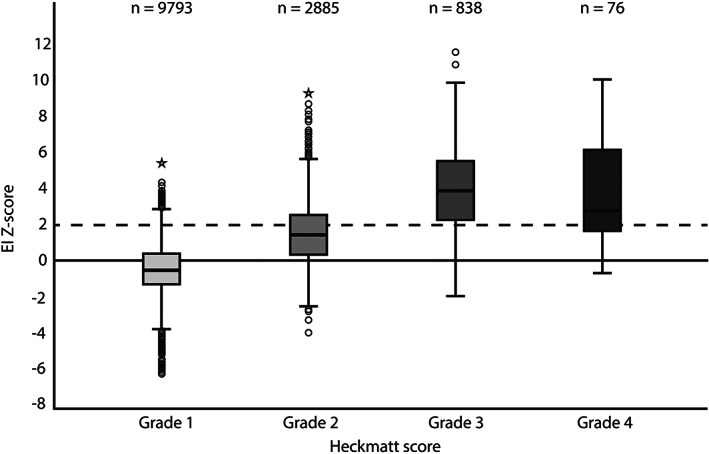
FIGURE 1.

Z‐scores per Heckmatt grade. The horizontal bar inside the boxes indicate the median and the lower and upper ends represent the first and third quartiles. The whiskers indicate values within 1.5× the IQR from the upper or lower quartile (or minimum and maximum if within 1.5× IQR of the quartiles). Circles and stars show values respectively greater than 1.5× or 3.0× IQR from the upper or lower quartile. The broken line refers to the threshold for abnormal z‐scores. The number of muscles per Heckmatt score is shown
