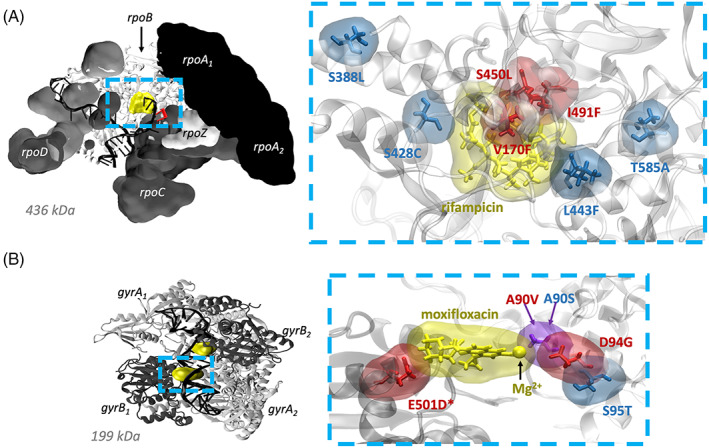
FIGURE 1.

Structures of Mycobacterium tuberculosis (A) RNA polymerase (RNAP) 28 and (B) DNA gyrase (DNAG) 27 cleavage complex, showing the selected clinical mutations associated with antibiotic resistance and susceptibility relative to the antibiotic binding sites. For clarity, RNAP subunits (excluding rpoB) are shown in surface view and nucleic acids are hidden in close‐up visualizations. Resistance‐conferring mutations are drawn in red, those associated with susceptibility blue and those residues where different mutations confer different resistance phenotypes purple. An asterisk (*) indicates a gyrB mutation.
