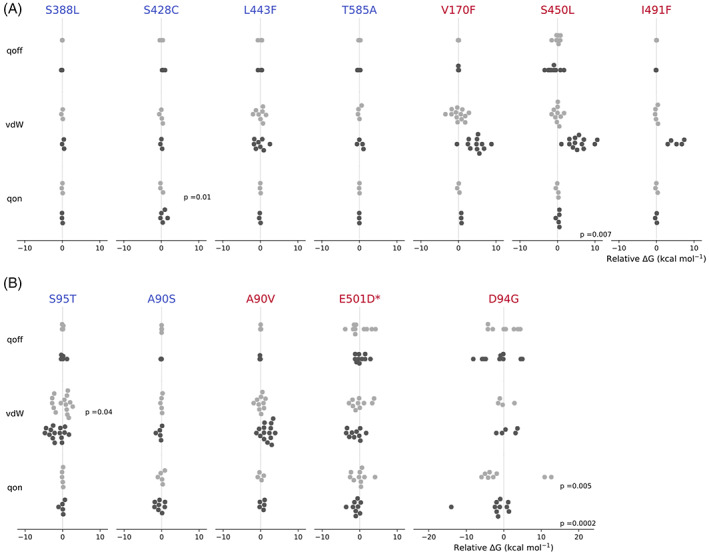
FIGURE 5.

Swarm plots of individual results from apo (light gray) and drug bound (dark gray) alchemical free energy calculations for mutations in the RNA polymerase (A) and DNA gyrase (B). All results are normalized to the mean of the calculations for the apo leg for each qoff, vdW, or qon transition for each mutation. P‐values from Shapiro Wilks test are displayed for each transition showing evidence of non‐normality in the repeated calculations, transitions where no p‐value is shown indicates there was no evidence of non‐normality in the data (p > 0.05). An asterisk (*) indicates a gyrB mutation.
