
FIGURE 2.
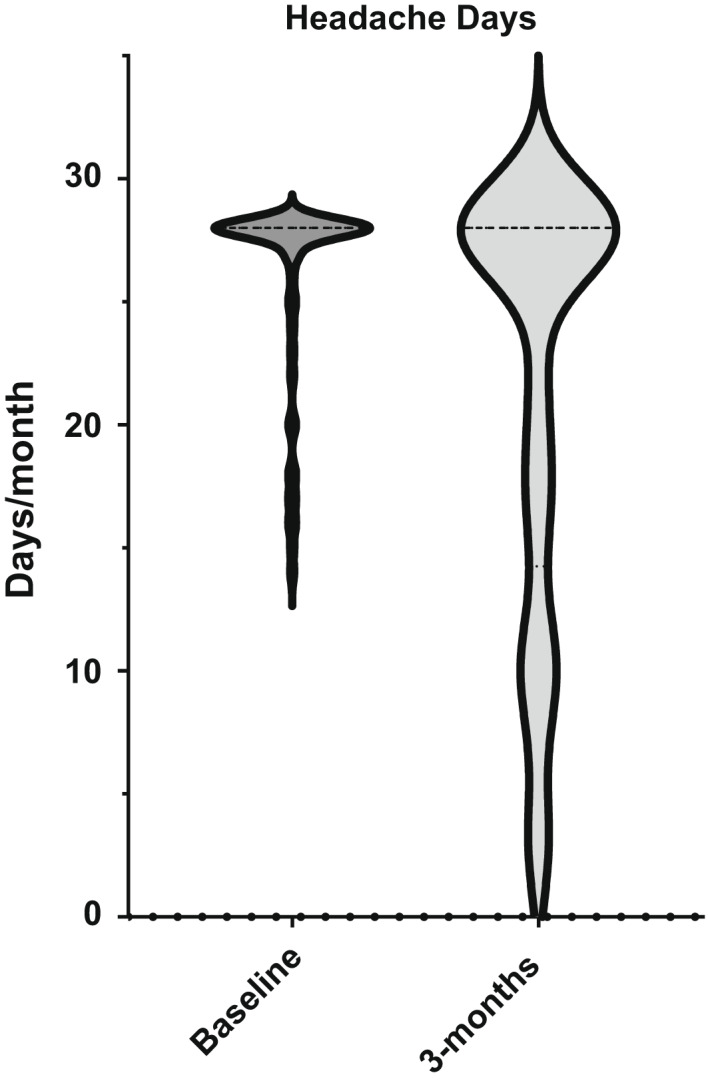
Violin plot showing shift in distribution after 3 months of treatment with erenumab in headache days
Official websites use .gov
A
.gov website belongs to an official
government organization in the United States.
Secure .gov websites use HTTPS
A lock (
) or https:// means you've safely
connected to the .gov website. Share sensitive
information only on official, secure websites.
Violin plot showing shift in distribution after 3 months of treatment with erenumab in headache days