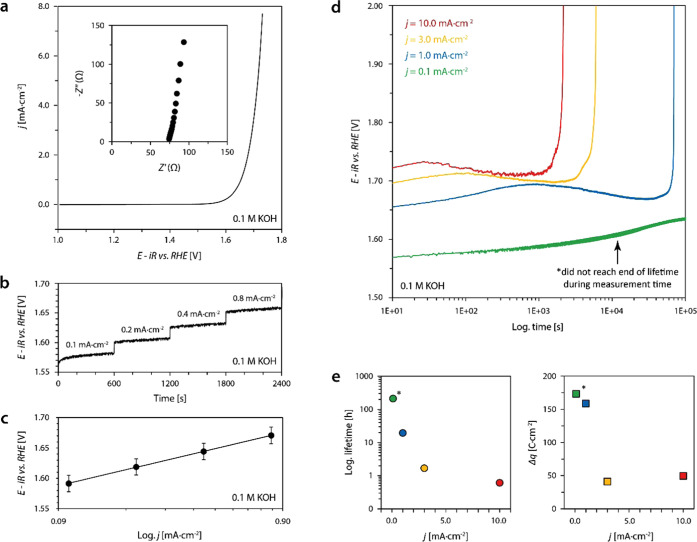
Figure 1.
Electrochemical performance of 20 nm epitaxial (001) LSCO thin films catalyzing the oxygen evolution reaction (OER). (a) Averaged forward and reverse scans of the second cycle of cyclic voltammetry measurements; the inset image shows the Nyquist plot obtained by electrochemical impedance spectroscopy. (b) Steady-state measurement of four consecutive galvanostatic holds. (c) Tafel plot obtained from steady-state galvanostatic measurements; error bars represent the standard deviation of average values obtained by the measurement of three different samples. (d) Chronopotentiometric measurements for the characterization of the LSCO stability on the basis of the catalyst lifetimes at different applied current densities. Abrupt increase of potential denotes the end of lifetime. (e) Plot of the lifetimes (left) and the respective transferred charge (right) depending on the applied current density determined based on the data shown in panel (d), visualizing a strong nonlinearity, i.e., potential dependence of the catalyst deactivation.

