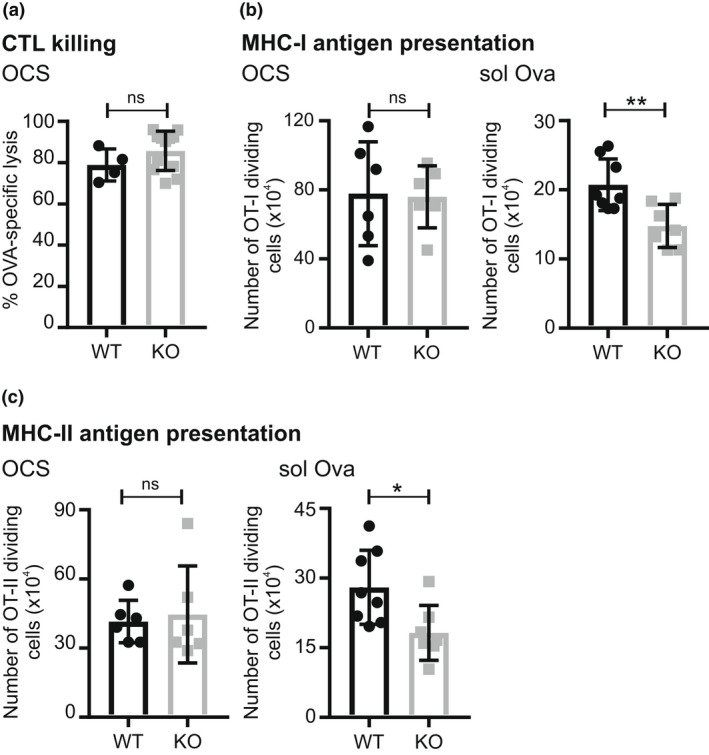
Figure 8.

Role of Mpeg 1 in antigen presentation. (a) H‐2K bm1 OCSs were intravenously injected into WT or Mpeg1 −/− mice, followed by intravenous injection of equal numbers of CTVhigh cells labeled with ovalbumin257–264 peptide and unlabeled CTVlow cells after 6–8 days. CTVhigh and CTVlow cell numbers in recipients were determined 36–48 h later by flow cytometry. (b) Equal numbers of CTV‐labeled OT‐I T cells were intravenously injected into WT or Mpeg1 −/− mice, followed by intravenous injection of 20 × 106 OCSs or 25 μg ovalbumin after 24 h. Dividing OT‐I T cells in spleen were enumerated 72 h later by flow cytometry. (c) Equal numbers of CTV‐labeled OT‐II T cells were intravenously injected into WT or Mpeg1 −/− mice, followed by intravenous injection of 20 × 106 IA b−/− OCS mice or 50 μg ovalbumin 24 h later. About 72 h later the number of OT‐II dividing cells in spleen was assessed by flow cytometry. The experiment was performed two times. Each data point represents a single mouse. Statistical significance was assessed using the Student's t‐test. ns = P > 0.05; *P < 0.05; **P < 0.01. CTL, cytotoxic T lymphocyte; CTV, Cell Trace Violet; MHC, major histocompatibility complex; Mpeg1, macrophage‐expressed gene 1; OCS, ova‐coated splenocyte; WT, wild type.
