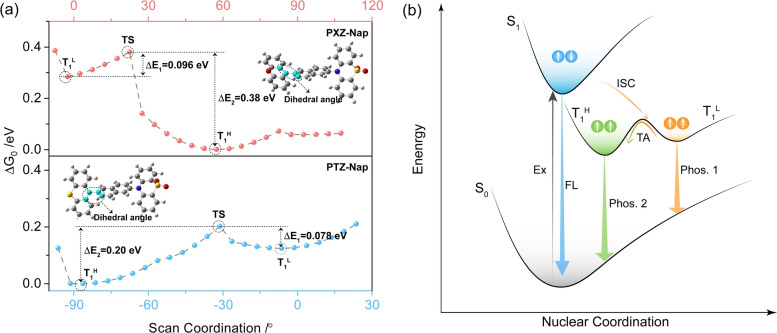
Figure 8.
a) Potential energy surface scan of PXZ‐Nap (top) and PTZ‐Nap (bottom) calculated in the gas phase at the uPBE0/6‐31G(d,p) level. Scanned dihedral angle highlighted in cyan. b) Mechanistic illustration of conformation‐regulated high‐lying triplet exciton emission using a simplified Jablonski diagram. TA denotes thermal activation.

