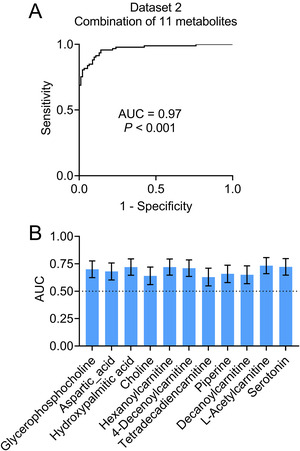
FIGURE 3.

Establishment of diagnostic panel for Alzheimer's disease in Data set 2. Receiver‐operating characteristic (ROC) curve analyses were performed by combining the 11 metabolites (A). ROC analyses of each metabolite were performed (B). Abbreviations: AUC, area under the curve. P < .001 (A) or .01 (B)
