
Figure 5.
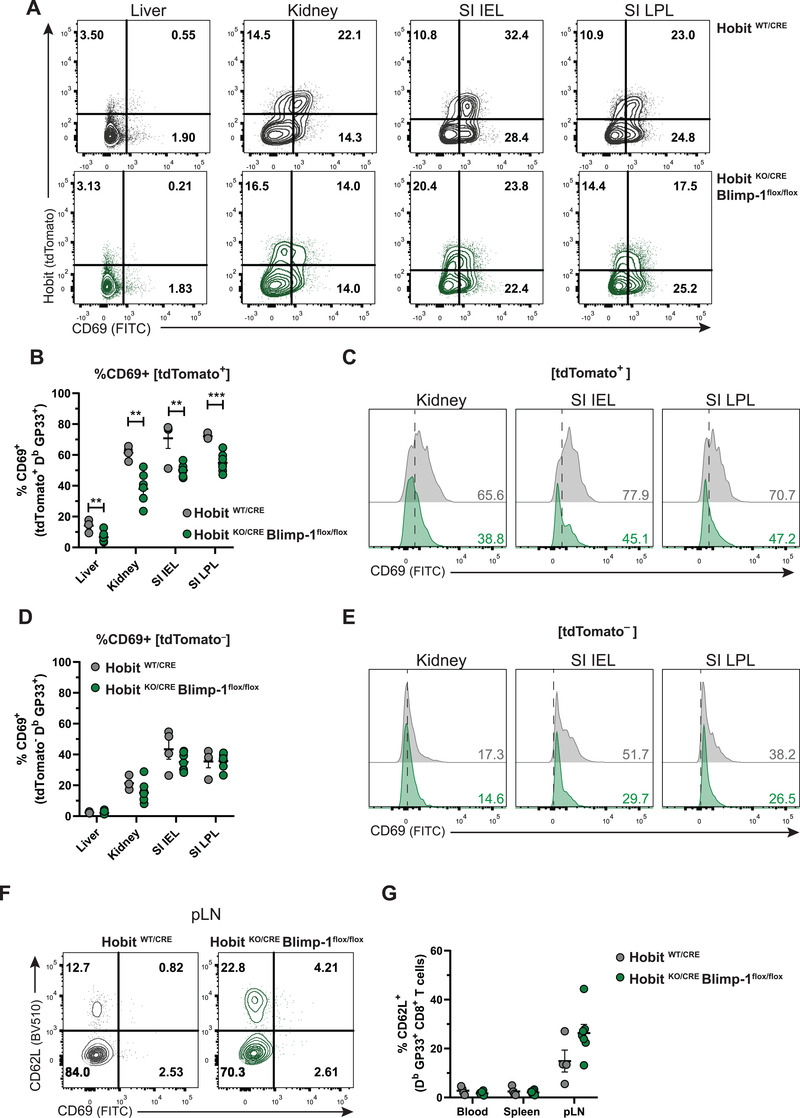
Hobit and Blimp‐1 promote CD69 expression on Trm precursors. (A) Representative flow cytometry plots display CD69 and tdTomato expression within GP33+ CD8+ T cells in the indicated tissues of HobitWT/CRE and HobitKO/CRE × Blimp‐1flox/flox mice at day 8 after LCMV infection. (B‐E) The percentage of CD69 expression was quantified in (B) tdTomato+ and (D) tdTomato‐ virus‐specific CD8+ T cells of HobitWT/CRE and HobitKO/CRE × Blimp‐1flox/flox mice. (C, E) Representative histograms display CD69 expression in (C) tdTomato+ and (E) tdTomato‐ virus‐specific CD8+ T cells in the indicated tissues of HobitWT/CRE (grey) and HobitKO/CRE × Blimp‐1flox/flox (green) mice. (F) Representative flow cytometry plots display CD69 and CD62L expression within GP33+ CD8+ T cells in the pLNs of HobitWT/CRE and HobitKO/CRE × Blimp‐1flox/flox mice at day 8 after LCMV infection. (G) The percentage of CD62L expression was quantified within GP33+ CD8+ T cells in the indicated tissues of HobitWT/CRE and HobitKO/CRE × Blimp‐1flox/flox mice at day 8 after LCMV infection. Combined data from two independent experiments (n = 4–7). Symbols represent individual mice. Error bars represent mean ± SEM. Unpaired t test. **p < 0.01, ***p < 0.001.