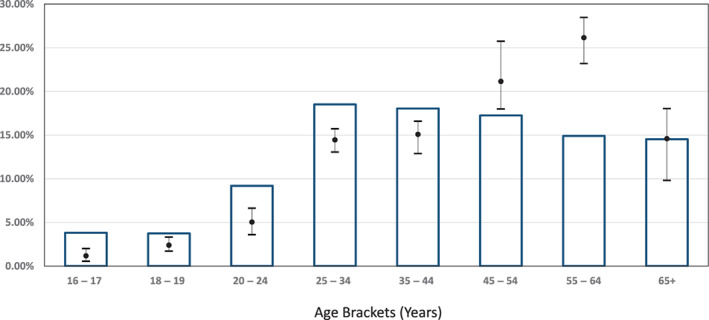
FIGURE 2.

Percentage of the general population, by age bracket (the histogram), in the Dallas Fort Worth metroplex and, for the same age brackets, the average daily percentages contribution to the red cell inventory (dot) and range (bars) for the period March 18–28, 2020
