
Figure 3.
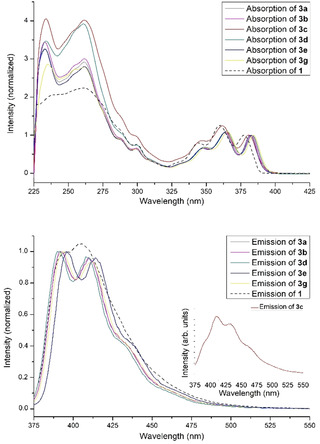
Absorption (normalized on maxima with longest wavelength, top) and fluorescence spectra (λ ex=347 nm, normalized on maxima with shortest wavelength, bottom) of the cycloaddition products in dichloromethane including absorption and fluorescence spectra of 1 (dashed line) for comparison. Inset: fluorescence spectrum of 3 c (Φ fl=0.07).