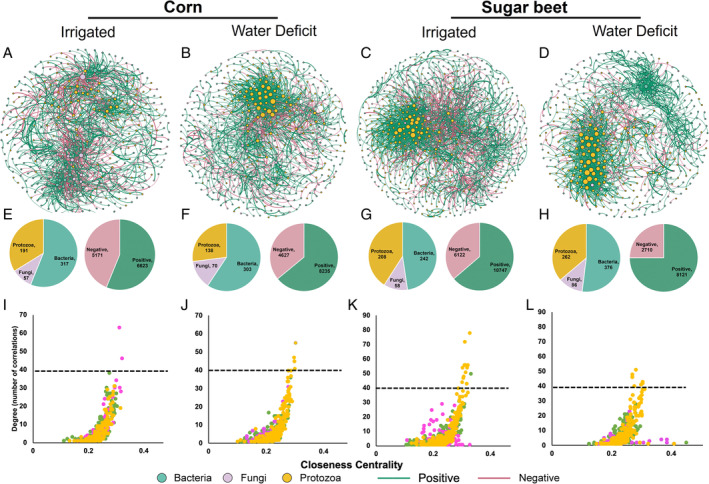
Fig. 4.

Co‐existing networks of soil bacteria, fungi and protists under different treatments (A – Irrigated Corn; B – Water Deficit Corn; C – Irrigated Sugar Beet; d‐ Water Deficit Sugar Beet). Nodes indicate microbial ASVs (green – bacteria, purple – fungi, yellow – protists) and edges indicate strong (r > 0.60) and significant (P < 0.01) correlations among ASVs (green edges indicate positive correlation and red edges indicate negative correlation). Under each network, the left pie chart indicates the number of ASVs from each group in individual network, and the right pie chart indicates the number of correlations (positive vs. negative) in each network (E–H). The scatter plots below show the importance of nodes in each network (I–L). Higher betweenness centrality indicates a potential connector while higher closeness centrality indicates a potential module hub.
