Fig. 1.

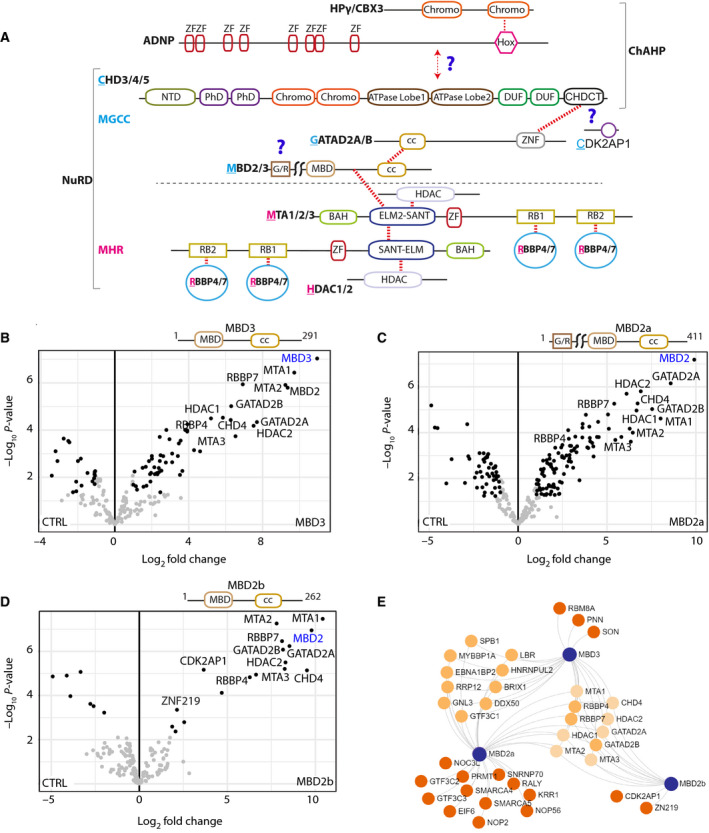
Mutual and distinct MBD binding partners revealed by PD‐MS. (A) Schematic diagram depicting the domain organisation of the NuRD and ChAHP complexes. Coloured regions indicate domains with known structures, or which are predicted to be ordered; and single lines specify regions predicted to be disordered. The total NuRD complex contains MHR and MGCC modules separated by a dashed line. CHD4 is a component of both ChAHP and NuRD complexes. Red dotted lines represent the intersubunit binding regions. Question marks indicate the regions of interaction that have not been well defined. (B–D) FLAG pulldowns were performed in triplicate followed by label‐free quantitative MS analysis, and LFQ intensities were used to generate the volcano plots. The canonical subunits of the NuRD complex are highlighted in black and noncanonical or potential new interactors in grey. Significantly enriched proteins in (B) MBD3 (C) MBD2a and (D) MBD2b pulldowns. Significantly enriched proteins are indicated with black dots; nonsignificant proteins are indicated with grey dots; the bait is indicated as blue text. (E) Network representation of shared and specific interactors of MBD proteins. Significantly enriched proteins with at least twofold change were used to generate the network.
