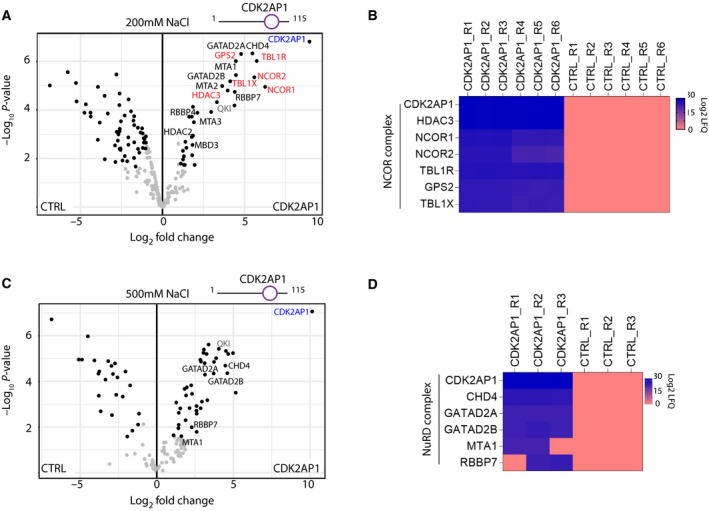
Fig. 4.

CDK2AP1 interacts with NuRD and NCOR complexes. (A and C) Volcano plots represent enrichment of the NuRD and NCOR subunits in FLAG‐CDK2AP1 and FLAG‐only CTRL pulldowns in the presence of (A) 200 mm NaCl (n = 6) and (C) 500 mm NaCl (n = 3). (B and D) LFQ intensity‐based heatmap of FLAG‐CDK2AP1 PD‐MS versus FLAG‐alone control (CTRL) showing: (B) NCOR complex subunits pulled down only with CDK2AP1 and not in any replicates of CTRL in presence of 200 mm NaCl; (D) Canonical NuRD subunits at 500 mm NaCl.
