
Fig. 6.
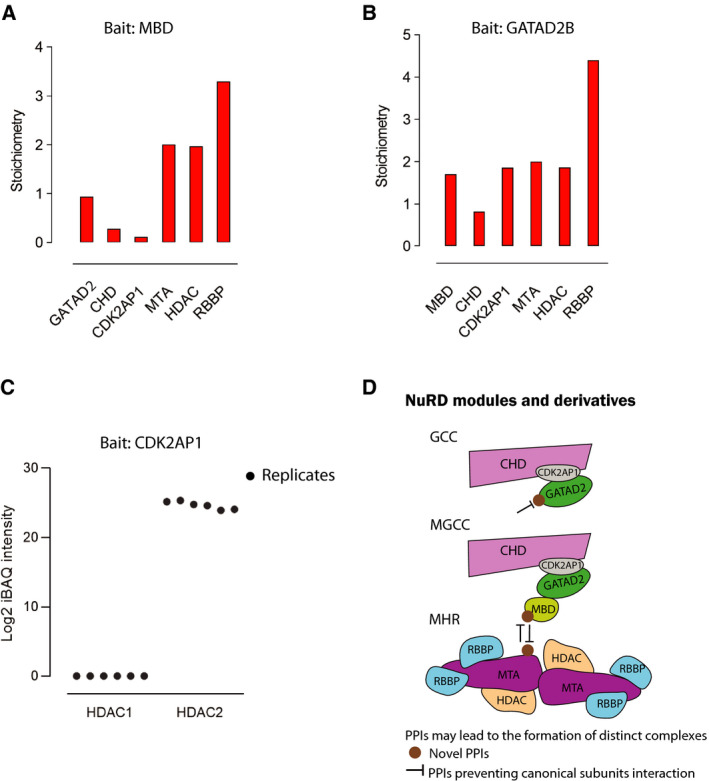
Stoichiometry of the NuRD subunits. MBD2/3 and GATAD2B were used as bait. Bait proteins were excluded from calculations, because they are in excess amount and introduce a bias in stoichiometry calculations. Stoichiometry of the subunits where (A) MBD2/3 and (B) GATAD2B were used as bait. (C) Scatter plot showing log2 of iBAQ intensities for HDAC1 and HDAC2 in all six replicates of CDK2AP1 PD‐MS. (D) Schematic representation of the possible new subcomplexes independent of the NuRD complex that can be formed via PPIs occurring with bridging subunits.