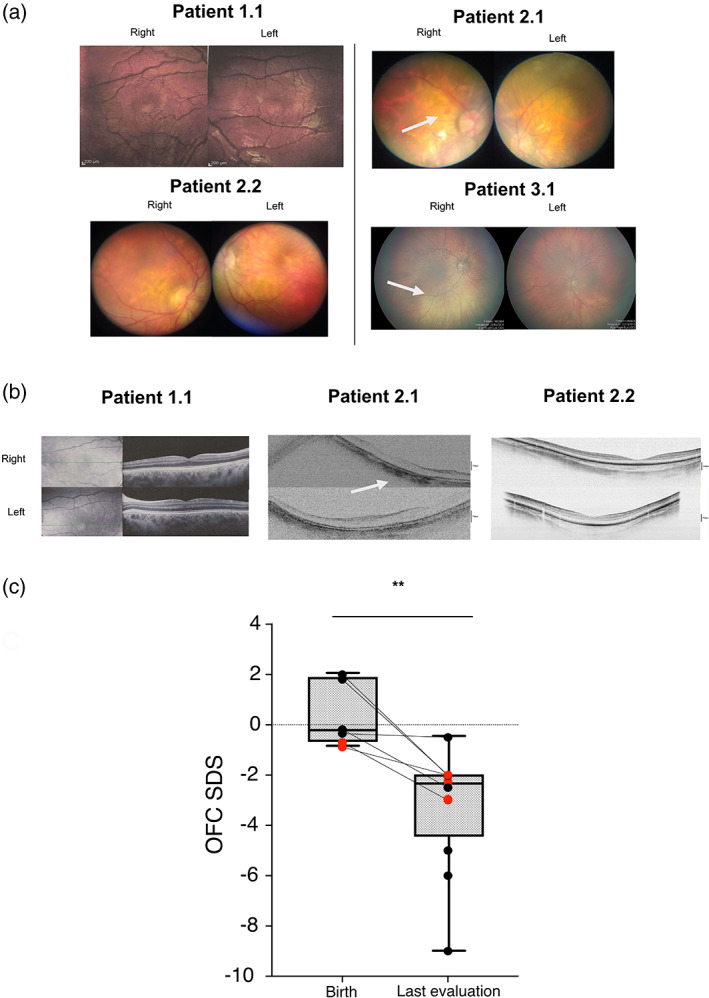
FIGURE 2.

(a) Patients 1.1 and 2.2: Fundus image showed macular region within normal limits. Patient 2.1: Fundus image showed marked myopic retinopathy with a small retinal hemorrhage next to the optic disk of the right eye (white arrow). Patients 3.1: Fundus showed hypopigmented retinas (white arrow), while maculas are pigmented. (b) Patients 1.1 and 2.2: Optical choerence tomography (OCT) of the macular region and of the nerve fiber layer within normal limits. Patient 2.1: OCT of the macular region showing a diffuse reduction of neuroretinal rim thickness (white arrow). (c) SDS of OFC at birth (n = 6) and at last evaluation (n = 12) of all reported patients with RPL10‐related disorder so far. OFC SDS at the latest available evaluation is statistically significantly different from birth OFC SDS (p = 0.003). Red dots correspond to the four pateints reported herein
