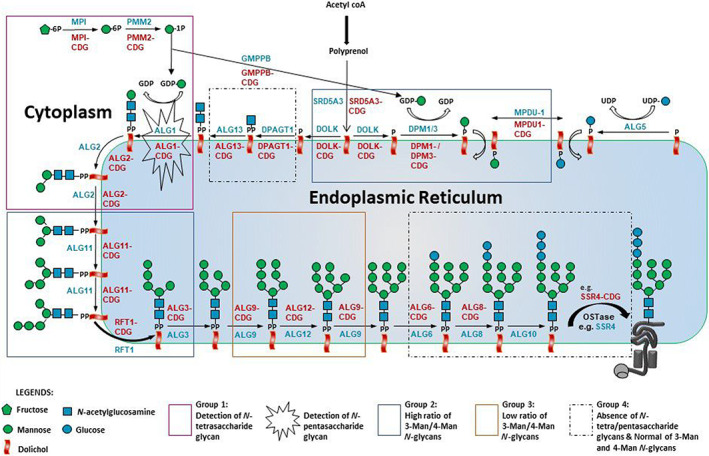
FIGURE 4.

N‐glycosylation pathway with indicated glycan abnormalities in congenital disorders of glycosylation type 1 (CDG‐I) defects. Four groups of gene defects (Groups 1–4) were determined on the basis of their total plasma glycoprofiling. A blue font color represents affected genes while a red font color represents a type of CDG on basis of standard CDG nomenclature
