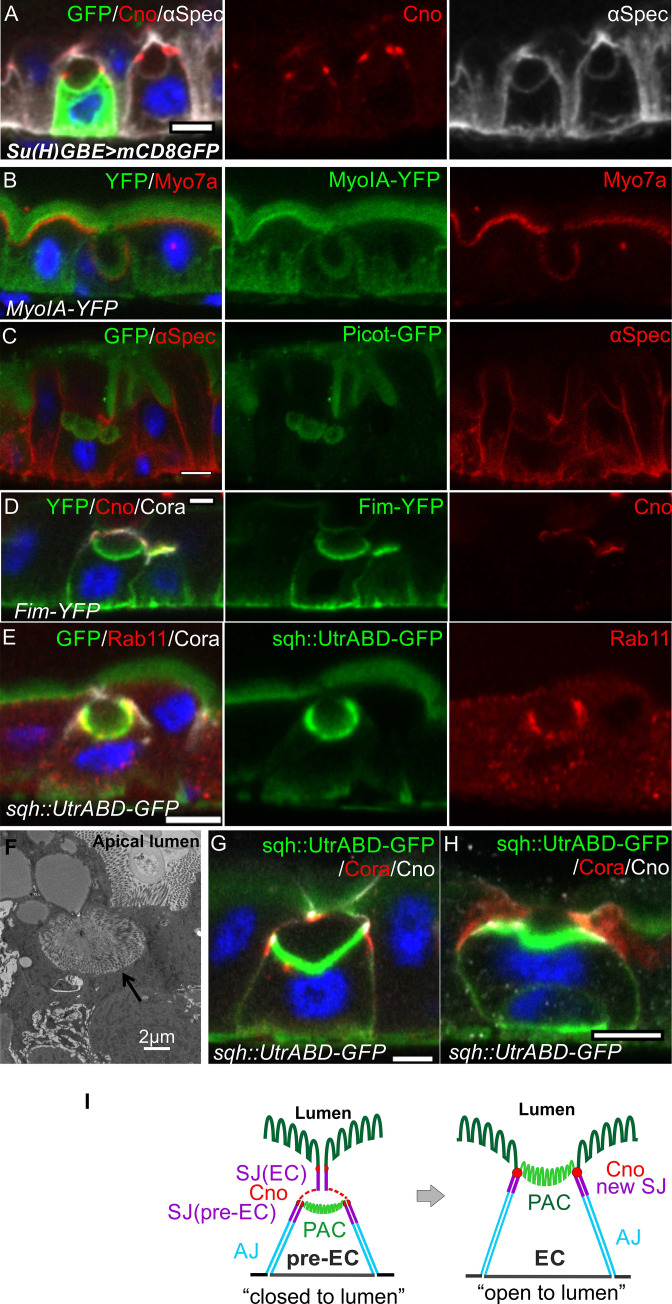
Figure 2. Integrating enteroblasts form an apical domain before reaching the gut lumen.
(A) A transverse section of a Su(H)GBE >mCD8 GFP midgut imaged 1 day after heat shock. Large spherical lumens surrounded by plasma membranes (α-spectrin; greyscale) have formed between the integrating enteroblasts and the overlying enterocytes. One enteroblast is still GFP-positive, indicating that it has recently been activated, whereas the other has lost Su(H)GBE >mCD8 GFP (green) expression. Canoe (red) labels the apical corners of the enteroblasts. (B) The lumen-facing side of the enteroblast is marked by MyoIA-YFP (green) and Myo7a (red), which are markers for the enterocyte brush border and apical cortex respectively. (C) A GFP protein trap line in the transmembrane transporter Picot (green) labels the apical brush border in enterocytes and the lumen-facing membrane in an integrating enteroblast. Note that multiple lumens have formed between the enteroblast and the enterocytes above. Plasma membranes are labelled with α-spectrin (red). (D) Fimbrin-GFP (Fim-GFP; green) marks the apical cortex of an integrating enteroblast and the enterocyte brush border. Note that the enteroblast to the right has not yet formed a lumen but has Fimbrin, Canoe (red) and Coracle (greyscale) localised to its apical surface. (E) The actin binding domain of Utrophin (Sqh::UtrABD-GFP; green) marks the enterocyte brush border and the apical side of an integrating enteroblast. The apical recycling endosome marker, Rab11 (red) also labels the apical region of the enteroblast. (F) A transmission electron micrograph showing that the lumen above an integrating enteroblast is surrounded by brush border microvilli. Scale bar, 2 µm. (G) An integrating enteroblast with a closed pre-apical compartment (PAC) and lumen that lie below the septate junction between the overlying enterocytes. The cells express the actin marker, Sqh::UtrABD-GFP (green), and are stained for Coracle (red) and Canoe (greyscale). (H) An integrating enteroblast stained as in (H) with an open lumen that is continuous with the gut lumen. (I) A model for enteroblast integration in which a ‘closed’ lumen above the PAC precedes an ‘open’ lumen. The ‘closed’ lumen stage represents the pre-EC with a PAC forming underneath the septate junction between the neighbouring enterocytes (purple), creating an isolated, closed lumen inside the epithelial layer. The cap over the ‘closed’ lumen comes from the neighbouring enterocytes. Adherens junctions form between pre-EC (light blue) and neighbouring enterocytes. New septate junctions also form between the pre-EC and the adjacent enterocytes (purple). The ‘open’ lumen represents a fully-developed enterocyte after the lumen has fused with the gut lumen, turning the PAC into the apical domain. To simplify the cartoons in the following figures, we combine the membranes between pre-EC and neighbouring ECs into one line. Scale bars in A-E, G and H, 5 µm.


