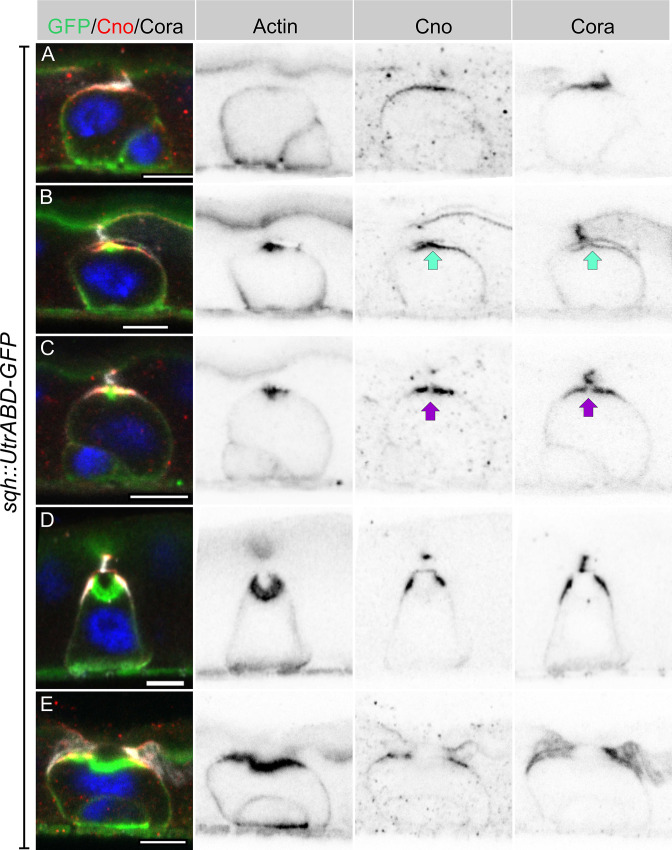
Figure 3. Integrating enteroblasts form an AMIS before forming a PAC.
(A) When enteroblasts reach the level of the septate junction between the adjacent ECs, Canoe (red) and Cora (greyscale) localise to the apical side of the enteroblast, whereas actin is still uniformly distributed around the enteroblast cortex (green, GFP staining in sqh::UtrABD-GFP flies). (B) AMIS (green arrow) formation in an integrating enteroblast. Actin now localises to the apical side of the enteroblast in a smaller domain than Cora and Canoe. Note that the plasma membrane in the AMIS forming region has detached from the neighbouring ECs. (C) Actin concentrates in the centre of the AMIS, while Canoe and Cora are excluded from this region (purple arrow). (D) The actin enrichment enlarges to form a pre-assembled apical compartment (PAC) below the septate junction between the neighbouring ECs. Cora localises to the septate junctions that are forming between the pre-enterocyte and mature enterocytes on either side. Canoe localises to the marginal zones above the septate junctions and is also enriched on the enterocyte membranes facing the PAC lumen. (E) The septate junction between the overlying enterocytes dissolves and allows the closed lumen to fuse with the gut lumen. Scale bars = 5 µm.


