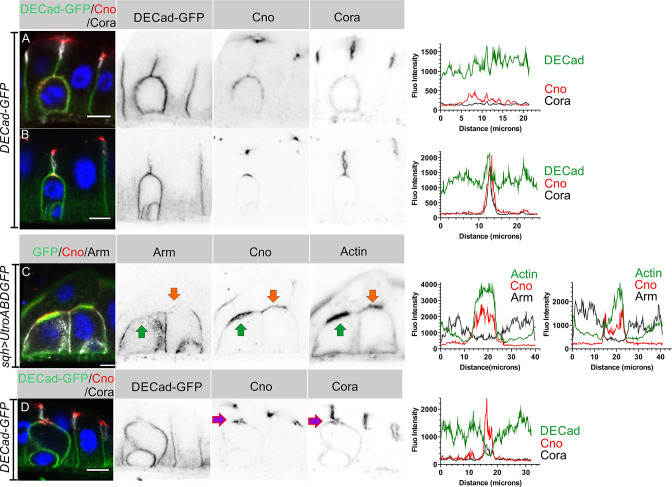
Figure 4. AJs are lost from the enteroblast apical membrane during AMIS formation.
(A) E-cadherin (green) localises all around the plasma membrane of integrating enteroblasts that have not yet reached the septate junction between the overlying enterocytes. Cora (greyscale) is not polarised at this stage and Canoe (red) is only weakly enriched apically. (B) Canoe and Cora form apical caps in enteroblasts that have reached the septate junction between the overlying enterocytes, but E-cadherin is still uniformly distributed along the enterocyte-enteroblast cell contact sites. This enteroblast is at the stage when Canoe is polarised but actin is not (see Figure 3A, Figure 3—figure supplement 1A and C). (C) AMIS formation (green arrow) in an integrating enteroblast. The Adherens junctions (Arm staining in white) disappear from the AMIS region. Canoe (red) localises to both the enteroblast and enterocyte membranes after their separation as seen in Figure 3B. The integrating enteroblast on the right (orange arrow) is at a slightly earlier stage before separation of the apical enteroblast membrane from the overlying enterocyte membranes. Actin (green) has started to accumulate apically, but at lower levels than in the left-hand enteroblast. (D) Ecad-GFP (green) is absent from the membrane around the pre-assembled apical compartment (purple arrow) as it forms. The fluorescence intensities of all labelled components are plotted in the panels next to the corresponding figures. Scale bars = 5 µm.


