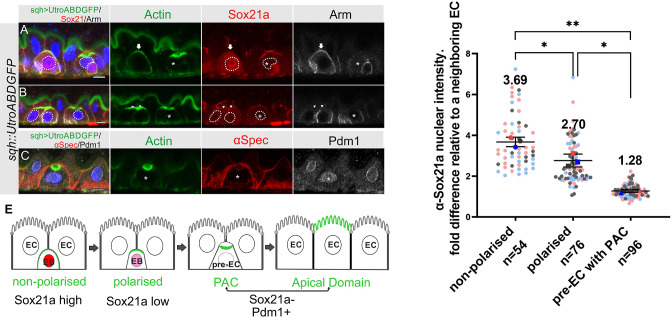
Figure 5. Sox21a levels fall as the PAC forms during integration.
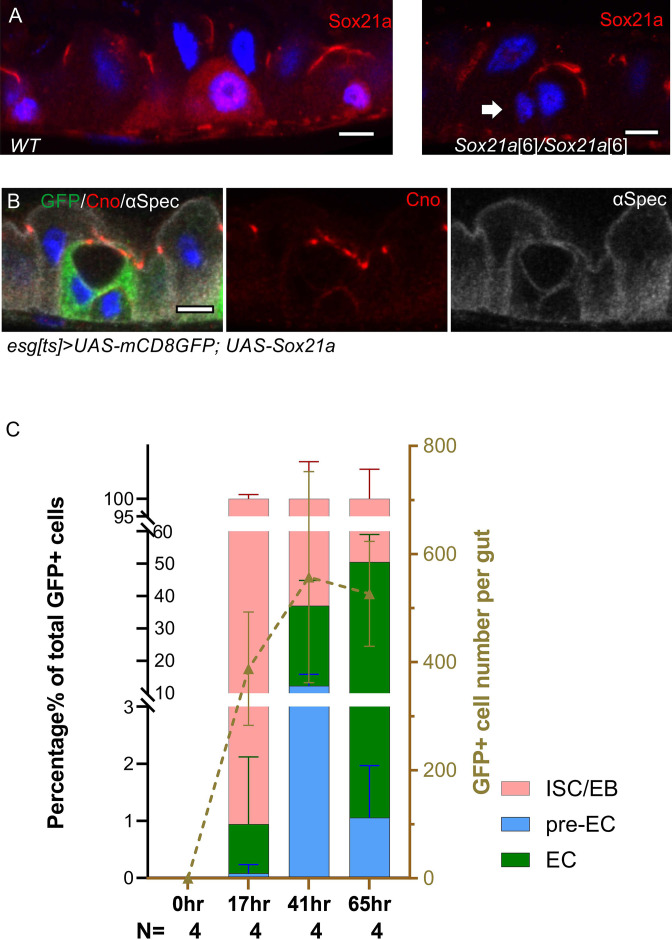
(A–B) Sox21a (red) is present at high levels in the nuclei of enteroblasts in which actin (Utr-ABD-GFP; green) is not yet polarised apically (arrow in A), is lower in the nuclei of enteroblasts with polarised actin (arrowheads in B). Pre-enterocytes that have formed a PAC (asterisks in A and B) lack nuclear Sox21a. The nuclei are outlined by white dashed lines. Note that the Adherens junctions (Armadillo; greyscale) still extend around the apical membrane of the enteroblast with unpolarised actin, but this signal has disappeared in the enteroblasts with apical actin (AMIS stage, arrowheads in B) and the pre-enterocytes with a PAC (*). The anti-Sox21a antiserum labels the septate junctions, but this is non-specific staining as it is still present in Sox21a mutant flies (see Figure 5—figure supplement 1A). (C) Pdm1+ (white) is expressed in a Pre-enterocyte with a PAC (asterisk); actin in green and αSpec in red. Scale bar = 5 µm. (D) Graph showing the levels of nuclear Sox21a staining relative to neighbouring enterocytes at different stages of enteroblast integration. The horizontal lines indicate the median values, which are significantly different by a two-tailed t test among three groups (**p<0.005, *p<0.05). n, the number of EB/neighbouring EC pairs. (E) Diagram showing the levels of nuclear Sox21a and Pdm1 during enteroblast integration.


