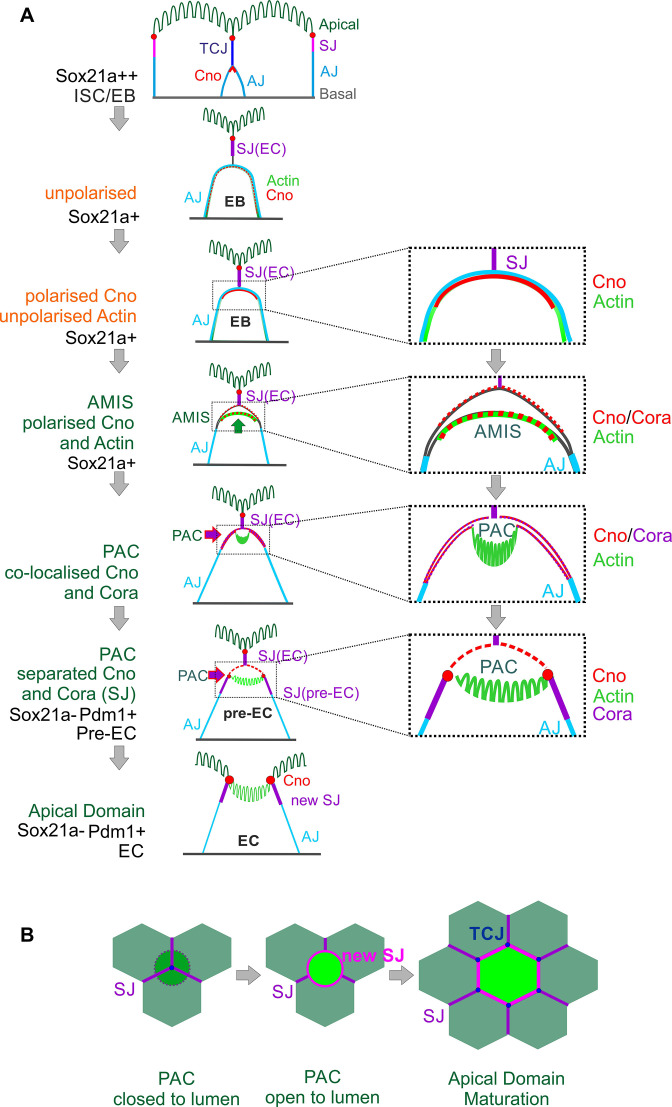
Figure 6. Diagram of the steps in enteroblast integration.
(A) Diagram shows the side view of the steps in enteroblast integration. ‘Unpolarised’ in the second panel of this figure indicates that the enteroblast has not formed a distinct apical domain. At this stage, no marker is clearly apically localised. ‘unpolarised’ or ‘polarised’ in the third and fourth panels describe the localisation of marker proteins such as Actin and Canoe. (B) Top view model of the last steps from ‘closed’ (dashed line) to ‘open’ lumen, and to the stage when the new EC forms a mature apical domain (green) and builds new SJs (purple) and tri-cellular junction (TCJ) (navy blue) with neighbouring ECs.

