. 2022 Sep 28;11:e76366. doi: 10.7554/eLife.76366

Figure 8. mesh mutants fail to form a PAC or form an internal PAC.

(A) A meshR2 homozygous MARCM clone marked by GFP (green). The mutant cells lack Mesh staining (red), fail to make septate junctions and do not reach the gut lumen. (B–C) meshR2 (B) and meshf04955 (C) homozygous mutant cells marked by the loss of GFP (green). The mutant cells form internal PACs that are marked by actin (red in B) and Myo7a (red in C). The cell in C has formed multiple internal PACs. (D) βH-spectrin (red) localises around the plasma membrane of meshR2 mutant enteroblasts (green), indicating that they do not polarise normally, but adherens junctions (Arm, greyscale) are still down-regulated at the apical surface. (E) meshR2 mutant enteroblasts (green) stained for Par-6 (red). Par-6 localises to the apical membrane (green arrow) in the enteroblast on the right, but localises around the internal PAC in the enteroblast on the left (green arrowhead). (F) A meshR2 mutant enteroblast stained for α-spectrin (greyscale) and Rab11 (red), which localises apically (green arrow). The α-spectrin staining reveals that a space has formed between the apical side of the integrating enteroblast and the neighbouring enterocytes. (G) A meshR2 mutant enteroblast stained for α-spectrin (greyscale) and Rab11 (red) that has formed an internal PAC. Rab11 decorates the surface of the internal PAC (green arrowhead). Note the younger, mutant enteroblast on the left (green arrow) localises Rab11 apically. (H) A meshR2 mutant enteroblast (green) with an internal PAC stained for Canoe (red) and α-spectrin (greyscale). Canoe does not localise to the internal PAC, which has no junctions. Scale bars = 5 µm. (I) Diagrams showing the distributions of Canoe, actin and adherens junctions in the three phenotypic classes of meshR2 mutant enteroblasts. The measurement of Canoe’s intensity in the WT and meshR2 mutant enteroblasts is shown in Figure 8—figure supplement 2 D&E. (J) Percentages of mesh, Tsp2a and ssk mutant enteroblasts in each of the classes in (I) compared to a wild-type control (FRT82B clones) based on actin in mutant cells (representative images in Figure 8—figure supplement 1E and F).

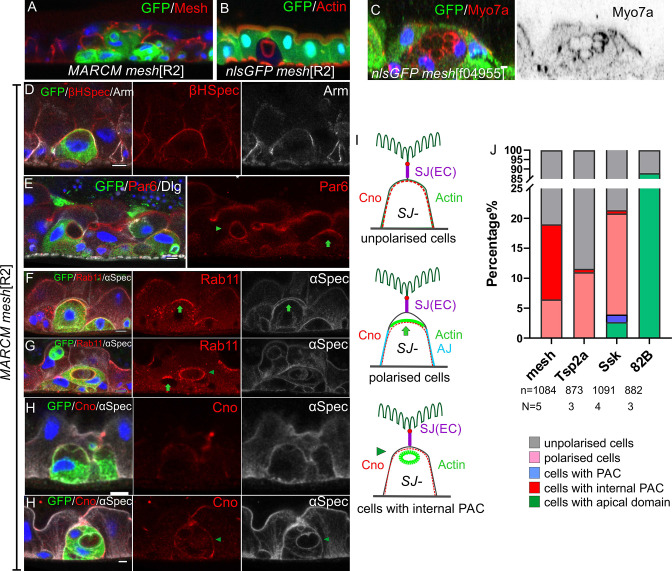
Figure 8—source data 1. Source data for the graph as Figure 8J.

Figure 8.

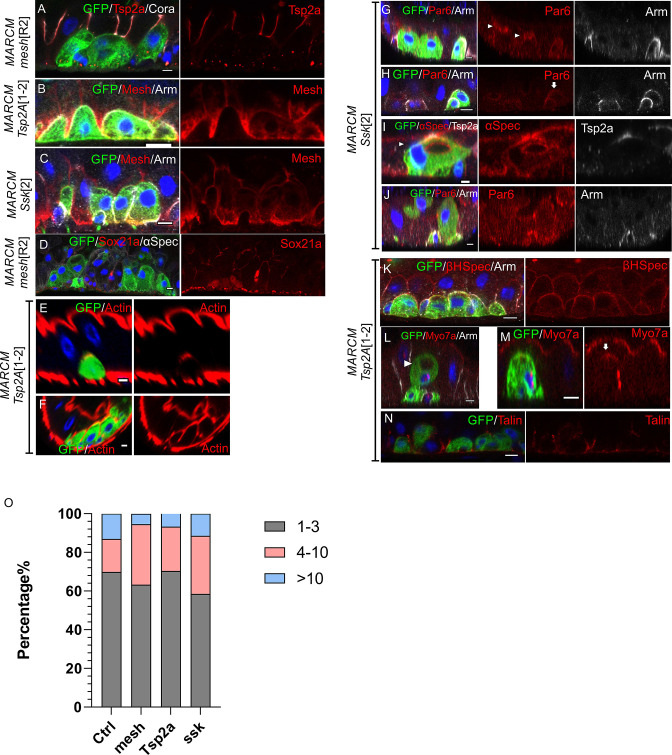
Figure 8—figure supplement 1. Phenotypes of other septate junction mutants.

Figure 8—figure supplement 1.

(A–C) The localisations of septate junction proteins are interdependent. Tsp2A (red) is lost from meshR2 mutant cells (green; A) and Mesh is not localised in Tsp2A1-2 (B) and ssk2 mutant cells (C). (D) Sox21a (red) is expressed and then down-regulated in meshR2 mutant enteroblasts as in wild-type. (E–F) Representative images showing actin in two phenotypic classes of Tsp2A1-2 mutant cells as in Figure 8J: actin in polarised cells (E) and unpolarised cells (F). (G–J) ssk2 mutant cells still polarise (H), form a PAC (arrowhead in G) or an internal PAC (arrowhead in I) and occasionally reach the gut lumen (J). Par-6, red. (K–M) Tsp2A1-2 mutant enteroblasts (green) fall into three phenotypic classes: unpolarised (K), with an internal PAC (L) and weakly polarised (M). (N) Tsp2A1-2 mutant enteroblasts (green) still localise Talin to the basal domain. Scale bars = 5 µm. (O) Graph showing the distribution of clone sizes in control FRT82B, mesh, ssk, and Tsp2a mutant MARCM flies. Mutant clones with 1–3 homozygous cells are shown in grey, 4–10 cells in pink and clones with over 10 cells in blue.
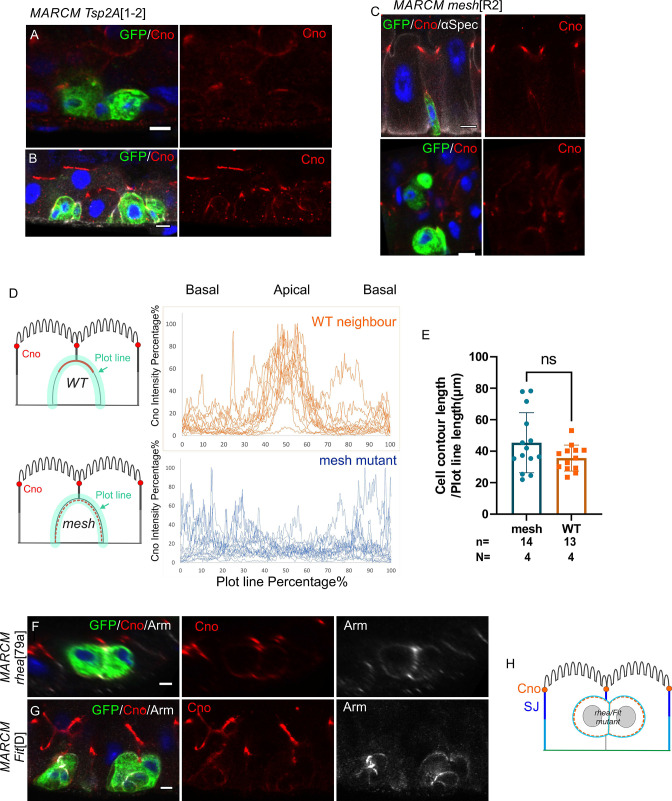
Figure 8—figure supplement 2. mesh and Tsp2a mutants disrupt the apical localisation on Canoe in integrating enteroblasts.

Figure 8—figure supplement 2.

(A–C) Canoe (red) is polarised in early stage Tsp2A1-2 (A) and meshR2 mutant enteroblasts (C). As Tsp2A1-2 mutant cells differentiate and integrate, Canoe becomes diffuse and no longer forms a clear apical domain (B). (D) Graph showing the intensity of Canoe staining around the cell cortex from the basal (0% and 100%) to the apical side (50%) of 13 wild-type (brown) and 14 meshR2 mutant cells. Canoe is enriched apically in wild-type cells, but not in meshR2 mutant cells. (E) The measured meshR2 mutant cells are in matching size to the measured WT neighbouring cells. (F–H) Canoe (red) is not localised in rhea79a (F) and FitD (G) mutant cells. Scale bars = 5 µm.
Figure 8—figure supplement 2—source data 1. Source data for the graphs as Figure 8—figure supplement 2D and E.