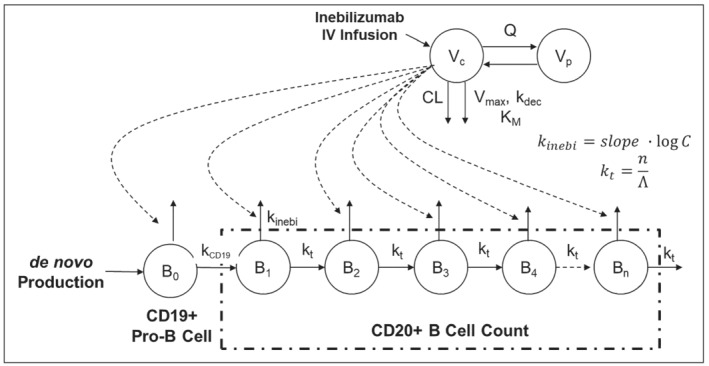
FIGURE 2.

A diagram of the pharmacodynamic model of inebilizumab in adults. B0, pro‐B cell; Bi, CD20+ B cells in each aging compartment; C, serum concentration of inebilizumab; CL, clearance; IV, intravenous; kCD19, rate constant representing the maturation of pro‐B to CD20+ B cells in the circulation; kdec, first‐order rate constant describing the decrease of Vmax over time; kinebi, accelerated removal of CD19+ pro‐B and mature B cells by inebilizumab; KM, concentration to achieve the half of Vmax; Vc, volume of distribution in the central compartment; n, number of transit compartments; Q, intercompartmental clearance; Vp, volume of distribution in the peripheral compartment; Vmax, maximum velocity of Michaelis–Menten equation; Λ, longevity (lifespan) of blood CD20+ B cells; kt, transit rate constant defined as the ratio of n and Λ
