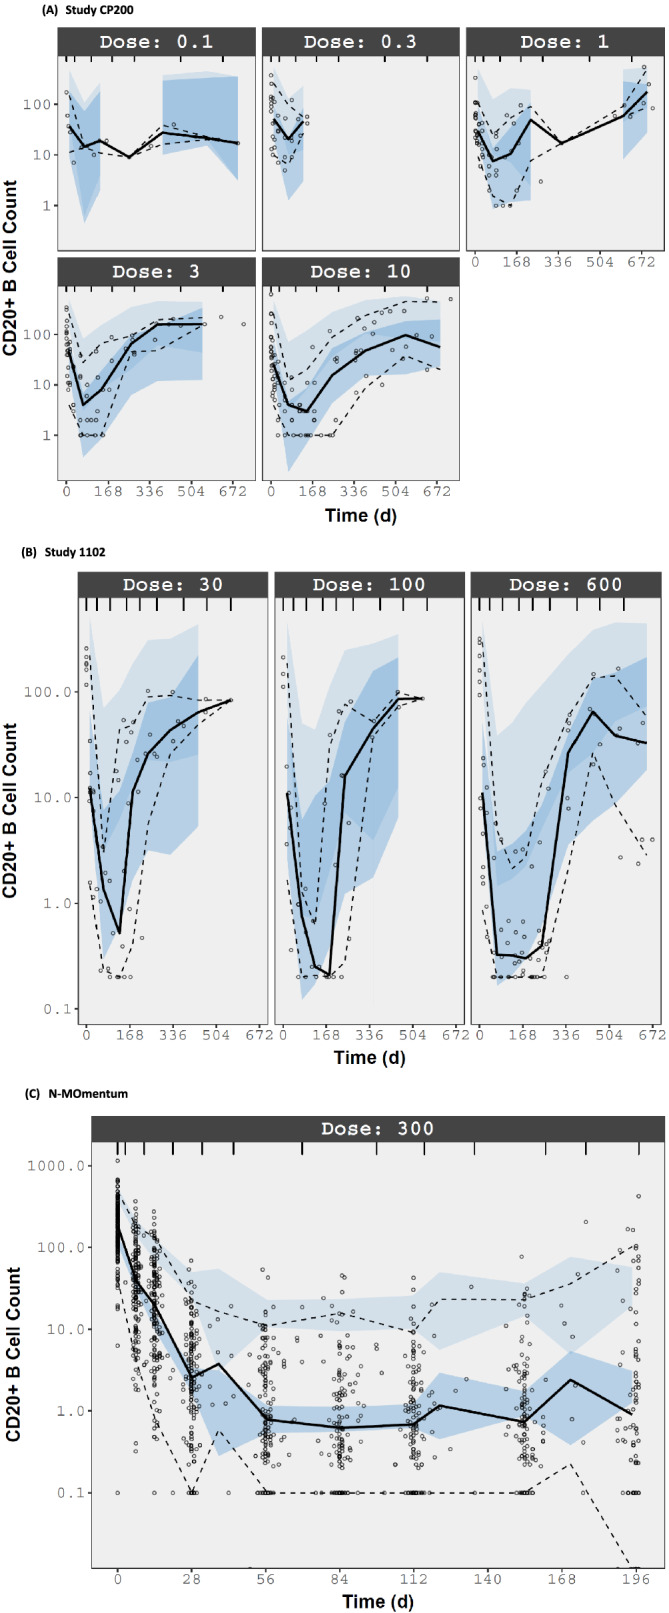
FIGURE 3.

Visual predictive check of inebilizumab PD model. All dose units in study CP200 are mg kg−1 and in studies 1102 and N‐MOmentum are mg. Symbol: observed CD20+ B‐cell count; Black solid and dotted lines: observed median, 5th and 95th percentiles. Shaded area: 90% confidence interval of predicted median, 5th and 95th percentiles from 200 clinical simulations
