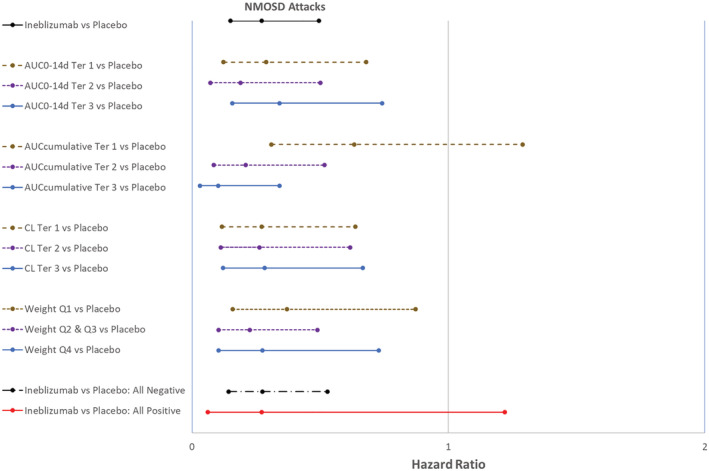
FIGURE 5.

Forest plot of reduction of Adjudication Committee‐determined neuromyelitis optica spectrum disorder attack by exposure, clearance, weight and ADA subgroups during the RCP. ADA, anti‐drug antibody; AUC0−14d, area under the concentration–time curve from Time 0 to 14 days postdose; AUC0−14d Ter 1, 300 mg inebilizumab‐treated subjects with low AUC0−14d; AUC0−14d Ter 2, 300 mg inebilizumab‐treated subjects with medium AUC0−14d; AUC0−14d Ter3, 300 mg inebilizumab‐treated subjects with high AUC0−14d; AUCcumulative, cumulative area under the concentration–time curve from time 0 of Dose 1 to the last measurable concentration in RCP; AUCcumulative Ter 1, 300 mg inebilizumab‐treated subjects with low AUCcumulative; AUCcumulative Ter 2, 300 mg inebilizumab‐treated subjects with medium AUCcumulative; AUCcumulative Ter 3, 300 mg inebilizumab‐treated subjects with high AUCcumulative; CL, systemic clearance; CL Ter 1, inebilizumab‐treated subjects with low CL; CL Ter 2, inebilizumab‐treated subjects with medium CL; CL Ter 3, inebilizumab‐treated subjects with high CL; RCP, randomized, controlled period; Weight Q1, inebilizumab‐treated subjects with lowest quartile body weight; Weight Q2 & Q3, inebilizumab‐treated subjects with interquartile range (2nd and 3rd quartile) of body weight; Weight Q4, inebilizumab‐treated subjects with highest quartile of body weight. All Negative, only subjects who were determined ADA negative; All Positive, only subjects who were determined ADA positive. Hazard ratio and 95% confidence interval <1 supports treatment with inebilizumab was better than placebo
