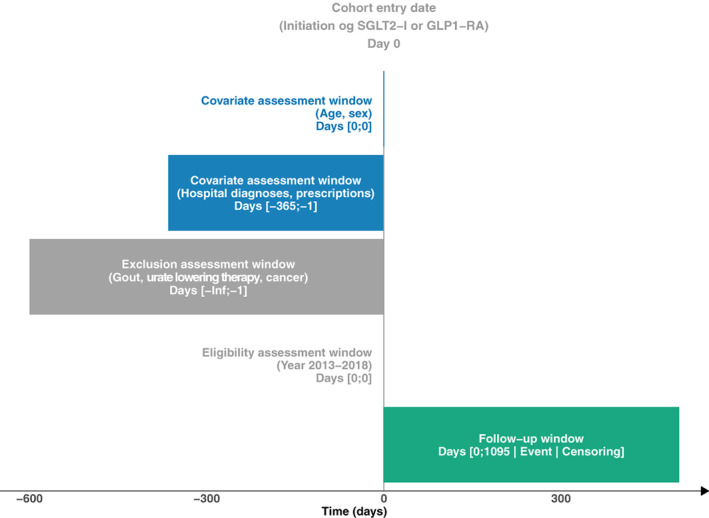
FIGURE 1.

A graphical representation of the study design of the cohort study “Assessing the Risk for Gout With Sodium‐Glucose Cotransporter‐2 Inhibitors in Patients With Type 2 Diabetes: A Population‐Based Cohort Study.” by Fralick et al. 21 The design diagram follows the concepts outlined by Schneeweiss et al 25 and it is created using the online tool provided by Lund et al. 26
